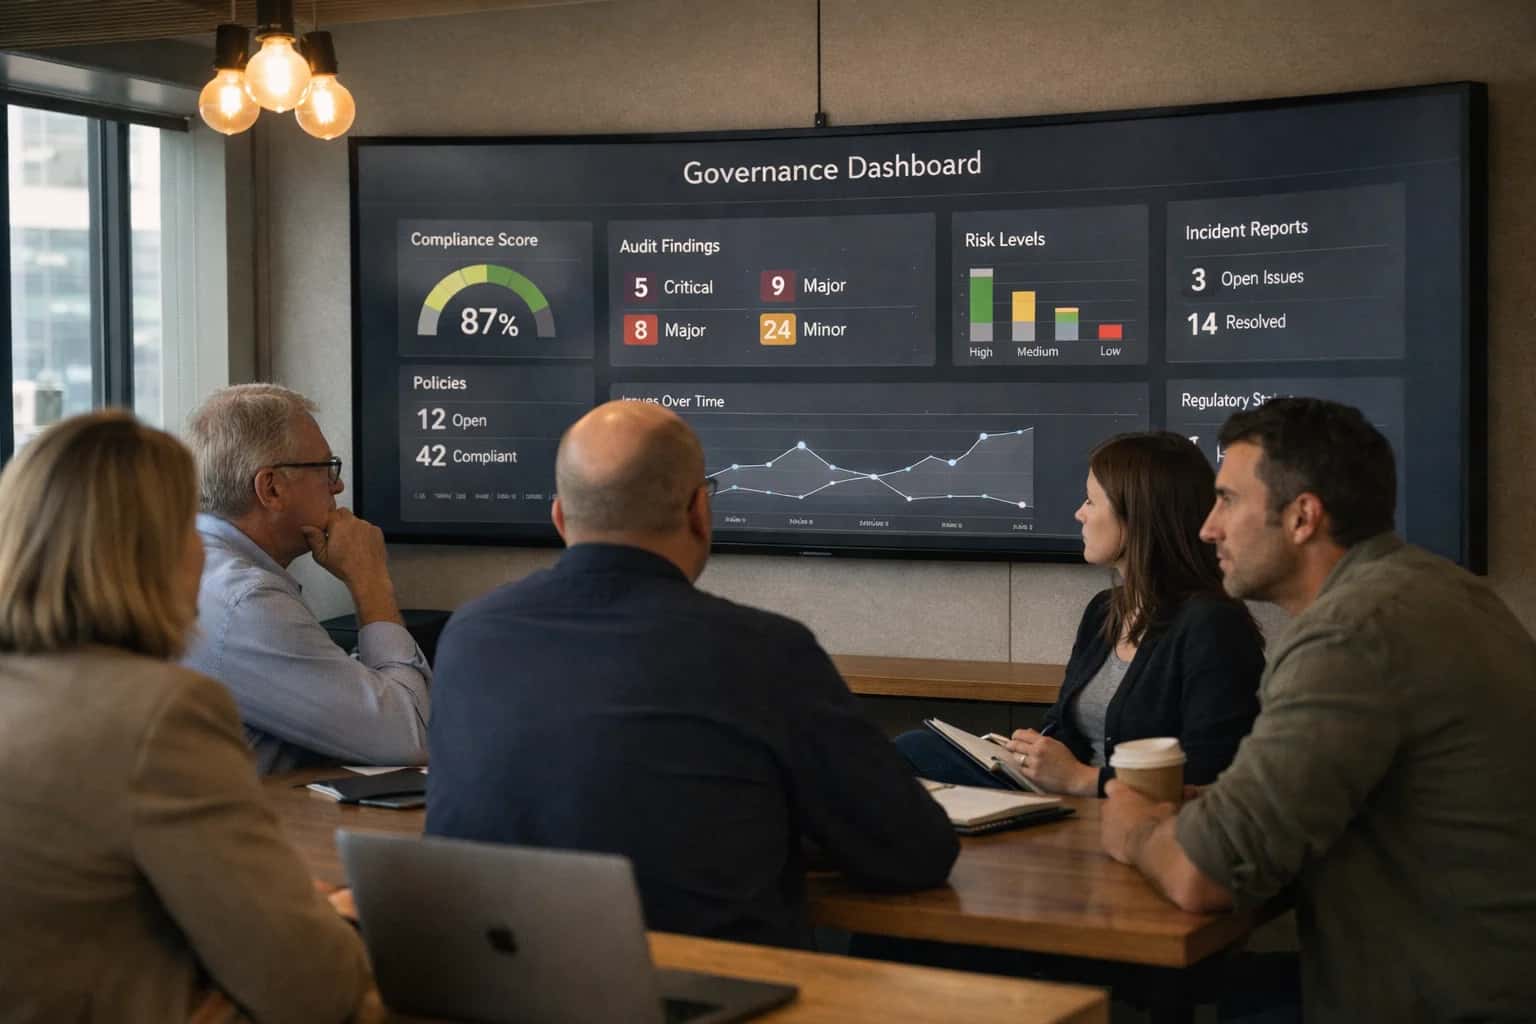
An AI Governance Dashboard is a centralized interface that aggregates data from your model registry, monitoring tools, audit logs, and compliance systems into actionable visualizations for leadership. Its purpose is to translate complex technical and operational data into a clear, executive-level view of governance health, enabling data-driven oversight and proactive risk management. This moves governance from a periodic audit function to a continuous, transparent practice integrated into daily operations.
Guide
How to Build an AI Governance Dashboard for Leadership
A technical guide to designing and implementing a centralized dashboard that provides executives with real-time visibility into AI governance health, risk indicators, and policy adoption.
A tactical guide to creating a centralized dashboard that provides executives with real-time visibility into AI governance health, risk indicators, and compliance status.
To build one, you must first instrument your MLOps pipeline to export key metrics—like model performance drift, fairness scores, and policy violation counts—to a time-series database. Use a visualization tool like Grafana or a custom React frontend to create panels for Key Risk Indicators (KRIs), audit coverage, and the operational status of high-risk systems. Link this dashboard to your AI Ethics Board charter and continuous audit program to demonstrate direct alignment between oversight mechanisms and real-world system behavior.
EXECUTIVE REPORTING
AI Governance Dashboard KPI Matrix
Essential metrics to track for leadership oversight, categorized by governance pillar.
| Governance KPI | Target | Current Status | Trend | Owner |
|---|---|---|---|---|
High-Risk Model Audit Coverage | 100% | 92% | 📈 Improving | AI Ethics Officer |
Average Review Cycle Time | < 48 hrs | 62 hrs | 📉 Degrading | Governance Board Chair |
Policy Violation Rate | < 0.1% | 0.3% | ➡️ Stable | Compliance Lead |
AI Incident Response Time (P1) | < 1 hr | 45 min | 📈 Improving | Security & Risk |
Employee Ethics Training Completion |
| 88% | 📉 Degrading | Head of Talent |
Explainability Score (High-Risk Models) |
| 7.9/10 | ➡️ Stable | ML Engineering Lead |
Model Drift Alert Resolution | < 24 hrs | 18 hrs | 📈 Improving | MLOps Team |
Stakeholder Satisfaction (Survey) |
| 4.2/5 | ➡️ Stable | AI Ethics Officer |
AI GOVERNANCE DASHBOARDS
Common Mistakes
Building an effective dashboard for leadership requires more than just aggregating data. Avoid these common pitfalls to ensure your dashboard drives informed, timely decisions instead of creating confusion.
Conflicting metrics arise from inconsistent data definitions and a lack of a single source of truth. If one team defines 'model drift' as a 5% change in statistical distribution and another uses a 10% threshold, leadership sees contradictory health indicators.
Fix: Before building visualizations, establish and document a governance data dictionary. Centralize metric calculations in a shared service or data pipeline, like a dedicated table in your data warehouse. Reference our guide on Setting Up Key Performance Indicators for AI Governance for standardizing measurements.
Enabling Efficiency, Speed & Accuracy
Intelligent Analysis, Decision & Execution
We build AI systems for teams that need search across company data, workflow automation across tools, or AI features inside products and internal software.
Talk to Us
Search across company data
Give teams answers from docs, tickets, runbooks, and product data with sources and permissions.
Useful when people spend too long searching or get different answers from different systems.
Enterprise searchRAGPermissions
Read more
Automate internal workflows
Use AI to route work, draft outputs, trigger actions, and keep approvals and logs in place.
Useful when repetitive work moves across multiple tools and teams.
AI agentsWorkflow automationGovernance
Read more
Add AI to products and internal tools
Build assistants, guided actions, or decision support into the software your team or customers already use.
Useful when AI needs to be part of the product, not a separate tool.
AI integrationDecision supportModel routing
Read moreAI GOVERNANCE DASHBOARD
Frequently Asked Questions
Building a dashboard for leadership requires connecting technical monitoring to business risk. These FAQs address the common developer challenges in aggregating data, defining metrics, and creating actionable executive views.
An effective dashboard aggregates data from four critical systems to provide a 360-degree view.
Model Registries (e.g., MLflow, Weights & Biases) provide lineage, version history, and approval status. Monitoring Tools (e.g., Arize, Fiddler, Evidently) supply real-time metrics on model performance, data drift, and fairness scores. Compliance & Audit Logs from your SDLC and MLOps pipelines track policy adherence and review completions. Incident Management Systems (e.g., Jira, PagerDuty) feed data on open issues and response times.
The key is to use APIs or data pipelines to stream this information into a central data store (like a time-series database) that powers the dashboard visualizations. Avoid manual reporting; automation is essential for credibility.

About the author
Prasad Kumkar
CEO & MD, Inference Systems
Prasad Kumkar is the CEO & MD of Inference Systems and writes about AI systems architecture, LLM infrastructure, model serving, evaluation, and production deployment. Over 5+ years, he has worked across computer vision models, L5 autonomous vehicle systems, and LLM research, with a focus on taking complex AI ideas into real-world engineering systems.
His work and writing cover AI systems, large language models, AI agents, multimodal systems, autonomous systems, inference optimization, RAG, evaluation, and production AI engineering.
LinkedIn
Limited slotsGet a Free AI Consultation
Partnered with leading AI, data, and software stack.


How We Work
Custom AI workflows for your Business
One-fit-all AI don't work for modern businesses. At Inferensys, we aim to understand your business & custom requirements; which we use to define most efficient agentic workflows, the data, and the tools for your business.
01
Review the use case
We understand the task, the users, and where AI can actually help.
Read more02
Pick the right approach
We define what needs search, automation, or product integration.
Read more03
Build the first useful version
We implement the part that proves the value first.
Read more04
Improve from there
We add the checks and visibility needed to keep it useful.
Read moreThe first call is a practical review of your use case and the right next step.
Talk to Us