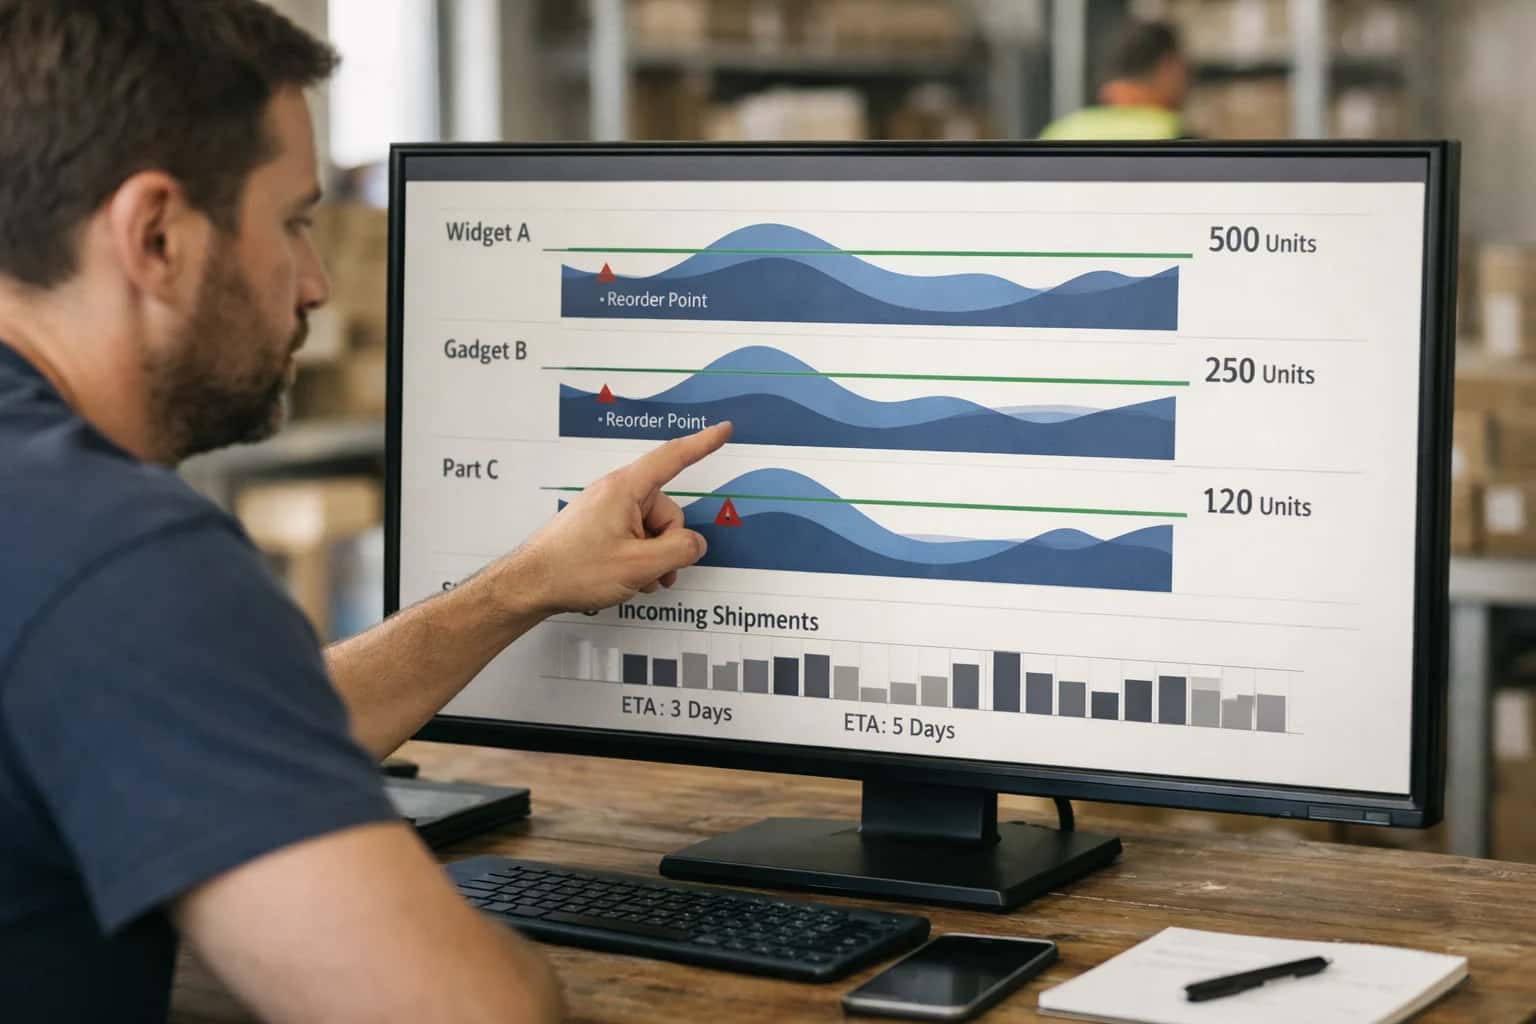
The Reorder Point (ROP) is a critical inventory control metric defined as the minimum quantity of a specific SKU that must be on hand to trigger a replenishment order. It is calculated by multiplying the average daily unit demand by the supplier lead time in days, with safety stock added to buffer against variability. When inventory depletes to this exact level, the system signals procurement to prevent a disruption in fulfillment.

Glossary
Reorder Point
The predetermined inventory level that triggers a new replenishment order, calculated to ensure stock arrives before a stockout occurs, considering forecasted demand and lead time.
INVENTORY CONTROL FUNDAMENTALS
What is Reorder Point?
The reorder point is the predetermined inventory threshold that automatically triggers a new replenishment order, calculated to ensure replacement stock arrives precisely before a stockout occurs.
In dynamic retail hyper-personalization systems, the reorder point is not a static value but a continuously recalculated parameter driven by real-time demand forecasting models. By integrating probabilistic forecasts that account for localized trends and promotional spikes, the ROP dynamically adjusts to minimize holding costs while maintaining service levels. This ensures that capital is not tied up in excess stock, yet the bullwhip effect is dampened through precise, data-driven replenishment triggers.
INVENTORY CONTROL PARAMETERS
Key Characteristics of an Effective Reorder Point
An effective reorder point (ROP) is not a static number but a dynamic threshold calculated to perfectly balance capital efficiency against service level risk. It must absorb the stochastic noise of both demand and supply to trigger replenishment at the precise moment required to prevent a stockout.
01
Demand Rate Integration
The ROP must be directly derived from a probabilistic demand forecast rather than a simple historical average. Using a single point estimate ignores variance and leads to chronic under- or over-stocking.
- Consumption Pattern: Ingests output from models like ARIMA, DeepAR, or TFT.
- Unit of Measure: Aligns with the forecast's time granularity (e.g., units per day).
- Dynamic Adjustment: The ROP recalculates as the forecast updates, preventing it from becoming a stale parameter.
02
Lead Time Variability Absorption
The ROP calculation must explicitly account for the total lead time—not just the average transit time, but the variance in supplier fulfillment, quality inspection, and put-away processes.
- Supply-Side Risk: Buffers against late shipments from manufacturers.
- Probabilistic Modeling: Uses the standard deviation of lead time to calculate safety stock requirements.
- End-to-End Visibility: Considers the time from order placement to shelf availability, not just shipping duration.
03
Safety Stock Buffer Calculation
The ROP is the sum of demand during lead time plus a safety stock buffer. This buffer is the critical shock absorber calculated from the convolution of demand and supply uncertainty.
- Service Level Target: Directly tied to a business-defined cycle service level (e.g., 95% or 99%).
- Z-Score Application: Uses a statistical multiplier (Z-score) against the combined standard deviation of demand and lead time.
- Cost Optimization: Balances the carrying cost of safety stock against the margin loss of a potential stockout.
04
Review Period Synchronization
In a periodic review system, the ROP must be elevated to account for the review interval—the fixed time between inventory checks. A stockout risk exists if demand spikes immediately after a review cycle closes.
- Protection Interval: Covers demand variability over the lead time plus the review period.
- System Alignment: Distinguishes between continuous review (perpetual) and periodic review (batch) inventory systems.
- Order Cycle Integration: Ensures the reorder quantity logic (e.g., EOQ) is compatible with the ROP trigger timing.
05
Segmentation and Granularity
A single ROP logic cannot govern an entire catalog. Effective systems segment SKUs based on demand volatility and revenue impact to apply differentiated inventory policies.
- ABC/XYZ Analysis: Combines value (ABC) with demand predictability (XYZ) to set distinct service levels.
- Intermittent Demand Handling: Applies specialized models like Croston's Method for SKUs with sporadic sales patterns.
- Long-Tail Protection: Prevents over-investment in slow-moving items while ensuring availability for critical components.
06
Exception-Based Monitoring
An effective ROP system includes automated alerts for boundary conditions where the mathematical model breaks down, such as product phase-outs or extreme supply disruptions.
- Phase-In/Phase-Out Logic: Adjusts ROP downward for end-of-life products to avoid obsolete stock.
- Promotional Lift Handling: Temporarily overrides the baseline forecast to account for planned marketing events.
- Bullwhip Effect Mitigation: Prevents the ROP from amplifying minor demand signals into massive upstream order spikes.
INVENTORY CONTROL MECHANISMS
Reorder Point vs. Safety Stock vs. Economic Order Quantity
A comparison of the three foundational calculations governing inventory replenishment: when to order, how much buffer to hold, and the optimal order size to minimize total cost.
| Feature | Reorder Point (ROP) | Safety Stock | Economic Order Quantity (EOQ) |
|---|---|---|---|
Primary Purpose | Triggers a replenishment order | Buffers against variability | Minimizes total inventory costs |
Core Formula Inputs | Lead time demand + Safety stock | Demand variability, lead time variability, service level | Annual demand, ordering cost, holding cost |
Answers the Question | When to order? | How much extra to hold? | How much to order? |
Directly Prevents Stockouts | |||
Directly Minimizes Cost | |||
Assumes Constant Demand | |||
Unit of Measure | Units of inventory | Units of inventory | Units per order |
Dependent on Lead Time |
INVENTORY INTELLIGENCE
Frequently Asked Questions
Clarifying the mechanics and strategic implications of the reorder point, the critical threshold that balances capital investment against the risk of lost sales in a dynamic supply chain.
A reorder point (ROP) is the predetermined minimum inventory level for a specific SKU that automatically triggers a new replenishment purchase order. It functions as a signal to restock before inventory is fully depleted. The fundamental mechanism is calculated by multiplying the average daily unit sales by the supplier lead time in days. For example, if you sell 10 units daily and your supplier takes 7 days to deliver, your basic ROP is 70 units. When on-hand inventory drops to this threshold, the system generates an order, ensuring the new shipment arrives just as the last unit is sold. This mechanism prevents stockouts while avoiding premature ordering that inflates holding costs. In dynamic retail hyper-personalization systems, this static calculation is often augmented with real-time demand signals to adjust the threshold dynamically.
Enabling Efficiency, Speed & Accuracy
Intelligent Analysis, Decision & Execution
We build AI systems for teams that need search across company data, workflow automation across tools, or AI features inside products and internal software.
Talk to Us
Search across company data
Give teams answers from docs, tickets, runbooks, and product data with sources and permissions.
Useful when people spend too long searching or get different answers from different systems.
Enterprise searchRAGPermissions
Read more
Automate internal workflows
Use AI to route work, draft outputs, trigger actions, and keep approvals and logs in place.
Useful when repetitive work moves across multiple tools and teams.
AI agentsWorkflow automationGovernance
Read more
Add AI to products and internal tools
Build assistants, guided actions, or decision support into the software your team or customers already use.
Useful when AI needs to be part of the product, not a separate tool.
AI integrationDecision supportModel routing
Read more
About the author
Prasad Kumkar
CEO & MD, Inference Systems
Prasad Kumkar is the CEO & MD of Inference Systems and writes about AI systems architecture, LLM infrastructure, model serving, evaluation, and production deployment. Over 5+ years, he has worked across computer vision models, L5 autonomous vehicle systems, and LLM research, with a focus on taking complex AI ideas into real-world engineering systems.
His work and writing cover AI systems, large language models, AI agents, multimodal systems, autonomous systems, inference optimization, RAG, evaluation, and production AI engineering.
LinkedIn
Limited slotsGet a Free AI Consultation
Partnered with leading AI, data, and software stack.





How We Work
Custom AI workflows for your Business
One-fit-all AI don't work for modern businesses. At Inferensys, we aim to understand your business & custom requirements; which we use to define most efficient agentic workflows, the data, and the tools for your business.
01
Review the use case
We understand the task, the users, and where AI can actually help.
Read more02
Pick the right approach
We define what needs search, automation, or product integration.
Read more03
Build the first useful version
We implement the part that proves the value first.
Read more04
Improve from there
We add the checks and visibility needed to keep it useful.
Read moreThe first call is a practical review of your use case and the right next step.
Talk to Us