Days of Cover is a forward-looking inventory metric that expresses the number of days current on-hand stock will satisfy projected demand. It is calculated by dividing current inventory by the average daily demand rate, providing a time-based view of depletion risk rather than a static quantity count.

Glossary
Days of Cover
Days of Cover is an inventory metric representing the number of days current on-hand stock will last given a projected daily demand rate, used to prioritize replenishment urgency.
INVENTORY METRIC
What is Days of Cover?
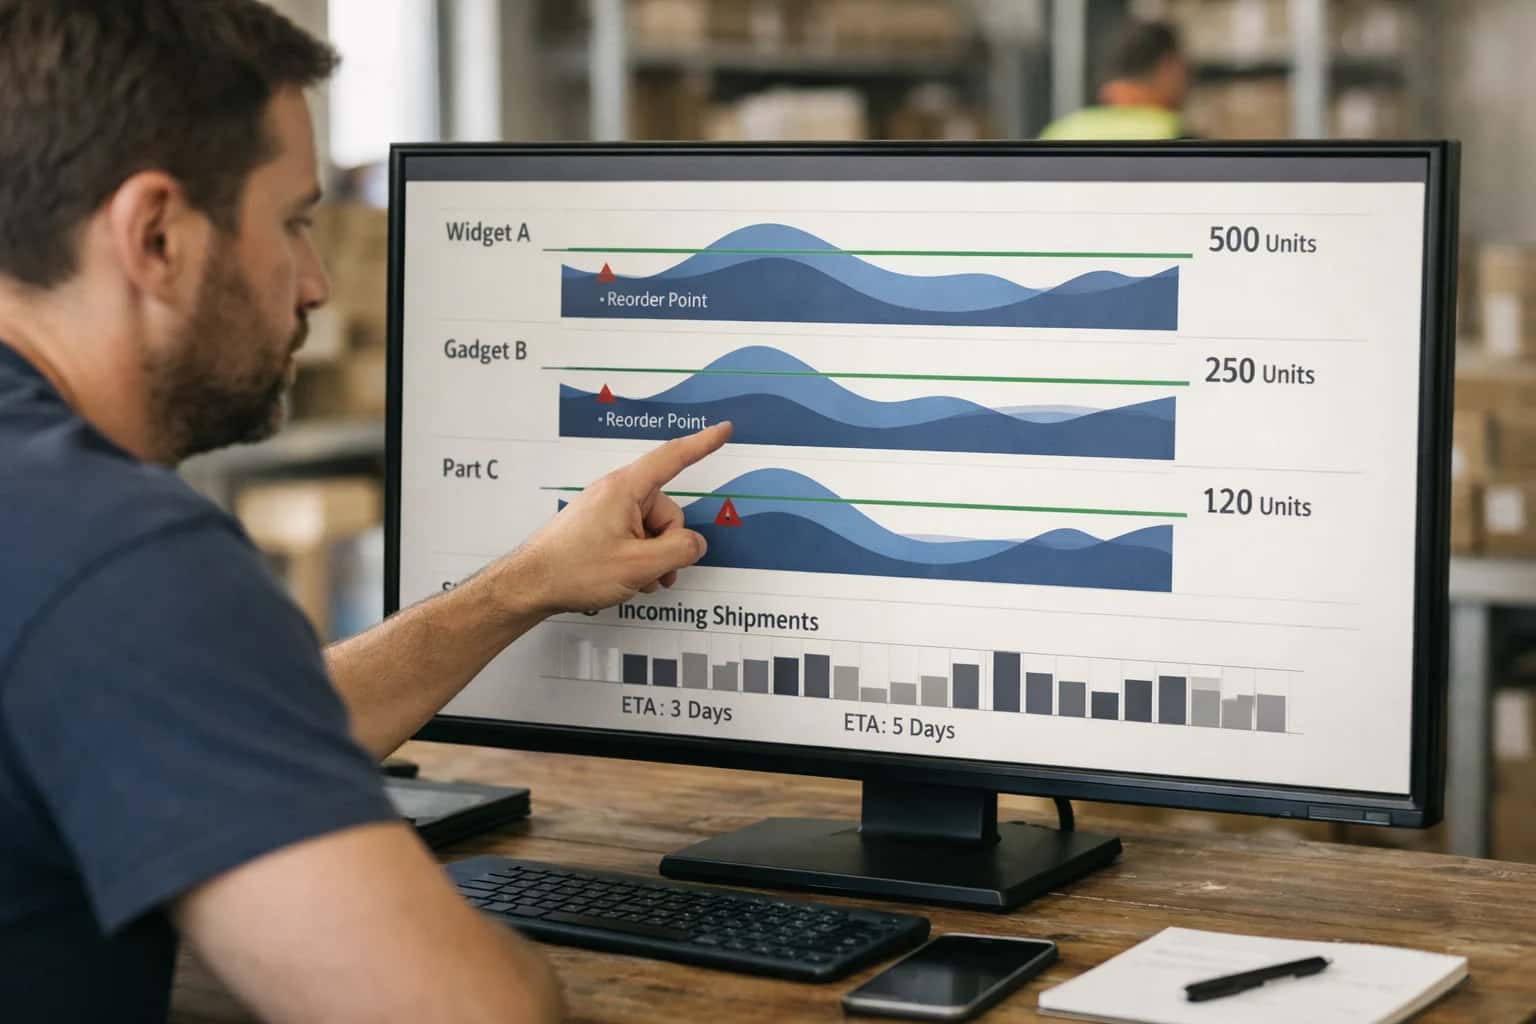
Days of Cover is a forward-looking inventory metric that expresses the number of days current on-hand stock will satisfy projected demand, enabling dynamic prioritization of replenishment.
This metric is critical for dynamic safety stock calculation as it directly triggers replenishment urgency. A low days of cover value signals imminent stockout risk, while an excessively high value indicates overstock and tied-up working capital, enabling planners to prioritize orders based on time-criticality.
INVENTORY METRIC
Key Characteristics of Days of Cover
Days of Cover (DOC) is a forward-looking metric that translates current on-hand inventory into a time-based measure of supply adequacy, enabling dynamic prioritization of replenishment urgency.
01
Forward-Looking Time Buffer
Unlike static reorder points, DOC expresses inventory health as a time-based projection. It divides current on-hand stock by the projected daily demand rate to determine exactly how many days of supply remain. This temporal view is critical for distinguishing between a SKU with 100 units and 10 days of demand versus one with 100 units and 2 days of demand.
Time-Based
Metric Type
02
Replenishment Prioritization Engine
DOC serves as the primary triage mechanism in dynamic inventory systems. Items with critically low days of cover are flagged for immediate replenishment, while those with excessive cover signal potential overstock risk. This ranking enables automated procurement agents to allocate constrained buying resources to the most urgent stock-keeping units first.
03
Dynamic Demand Rate Sensitivity
The accuracy of DOC depends entirely on the projected daily demand rate used in the denominator. In dynamic safety stock systems, this rate is continuously recalculated using:
- Demand sensing algorithms that detect short-term consumption shifts
- Probabilistic demand forecasting that accounts for trend, seasonality, and volatility clustering
- Intermittent demand models for SKUs with sporadic consumption patterns
04
Integration with DDMRP Buffer Zones
In Demand Driven Material Requirements Planning (DDMRP), DOC directly maps to buffer zone status. The Net Flow Equation—on-hand plus on-order minus qualified sales order demand—is divided by the average daily usage to determine position within the green, yellow, or red zones. A DOC falling into the red zone triggers expedited replenishment signals.
05
Lead Time Contextualization
DOC gains operational meaning when compared against actual supplier lead times. A DOC of 5 days is adequate if the replenishment lead time is 2 days, but catastrophic if lead time is 14 days. Advanced systems calculate a Cover-to-Lead-Time Ratio to normalize urgency across suppliers with vastly different replenishment cycles, enabling apples-to-apples prioritization.
06
Exception-Based Alerting Threshold
DOC is the foundation for supply chain control tower alerts. Configurable thresholds automatically generate exceptions when:
- DOC drops below safety time buffers
- DOC exceeds maximum target, indicating excess working capital
- DOC trajectory shows rapid deterioration, signaling demand spikes or supply disruptions These alerts enable planners to manage by exception rather than reviewing every SKU.
INVENTORY METRICS
Frequently Asked Questions
Clear answers to the most common questions about Days of Cover, its calculation, and its role in dynamic inventory replenishment.
Days of Cover is an inventory metric representing the number of days current on-hand stock will last given a projected daily demand rate. It is calculated by dividing the current on-hand inventory quantity by the average daily demand forecast. For example, if a warehouse holds 500 units and the forecasted daily demand is 50 units, the Days of Cover is 10 days. This calculation provides a time-based view of inventory health, translating absolute stock quantities into operational runway. In dynamic systems, the denominator is not a static average but a probabilistic demand forecast that updates continuously, making the metric a real-time indicator of replenishment urgency rather than a historical snapshot.
Enabling Efficiency, Speed & Accuracy
Intelligent Analysis, Decision & Execution
We build AI systems for teams that need search across company data, workflow automation across tools, or AI features inside products and internal software.
Talk to Us
Search across company data
Give teams answers from docs, tickets, runbooks, and product data with sources and permissions.
Useful when people spend too long searching or get different answers from different systems.
Enterprise searchRAGPermissions
Read more
Automate internal workflows
Use AI to route work, draft outputs, trigger actions, and keep approvals and logs in place.
Useful when repetitive work moves across multiple tools and teams.
AI agentsWorkflow automationGovernance
Read more
Add AI to products and internal tools
Build assistants, guided actions, or decision support into the software your team or customers already use.
Useful when AI needs to be part of the product, not a separate tool.
AI integrationDecision supportModel routing
Read moreMETRIC COMPARISON
Days of Cover vs. Related Inventory Metrics
A comparative analysis of Days of Cover against other key inventory performance indicators, highlighting their distinct purposes, calculation inputs, and operational applications.
| Metric | Days of Cover | Safety Stock | Reorder Point |
|---|---|---|---|
Primary Purpose | Measures how long current inventory will last given projected demand | Buffers against demand and supply variability to prevent stockouts | Triggers a new replenishment order when inventory falls to a specific level |
Core Calculation Input | Current on-hand inventory and projected daily demand rate | Demand variability, lead time variability, and target service level | Forecasted demand during lead time plus safety stock quantity |
Unit of Measurement | Time (number of days) | Quantity (units) | Quantity (units) |
Temporal Focus | Forward-looking projection of depletion | Statistical buffer for uncertainty | Specific moment in time for action |
Primary User | Inventory planners and category managers for prioritization | Supply chain analysts and finance controllers for policy setting | ERP systems and procurement agents for automated execution |
Key Decision It Drives | Replenishment urgency and expediting priority | Target inventory investment and service level trade-offs | Order release timing and quantity |
Dynamic Recalculation Trigger | Real-time changes in demand rate or inventory depletion | Changes in demand volatility, lead time, or service level targets | Adjustments to safety stock parameters or lead time forecasts |
Relationship to Stockouts | Indicates time remaining before a potential stockout occurs | Designed to absorb variability and prevent stockouts | Ensures new stock arrives before safety stock is fully consumed |

About the author
Prasad Kumkar
CEO & MD, Inference Systems
Prasad Kumkar is the CEO & MD of Inference Systems and writes about AI systems architecture, LLM infrastructure, model serving, evaluation, and production deployment. Over 5+ years, he has worked across computer vision models, L5 autonomous vehicle systems, and LLM research, with a focus on taking complex AI ideas into real-world engineering systems.
His work and writing cover AI systems, large language models, AI agents, multimodal systems, autonomous systems, inference optimization, RAG, evaluation, and production AI engineering.
LinkedIn
Limited slotsGet a Free AI Consultation
Partnered with leading AI, data, and software stack.





How We Work
Custom AI workflows for your Business
One-fit-all AI don't work for modern businesses. At Inferensys, we aim to understand your business & custom requirements; which we use to define most efficient agentic workflows, the data, and the tools for your business.
01
Review the use case
We understand the task, the users, and where AI can actually help.
Read more02
Pick the right approach
We define what needs search, automation, or product integration.
Read more03
Build the first useful version
We implement the part that proves the value first.
Read more04
Improve from there
We add the checks and visibility needed to keep it useful.
Read moreThe first call is a practical review of your use case and the right next step.
Talk to Us