This prompt is for AI operations teams and platform engineers who need to move from reactive token-cost surprises to proactive budget monitoring. The job-to-be-done is generating a production-ready alert configuration—complete with thresholds, anomaly detection rules, and escalation paths—that can be wired into existing observability stacks. The ideal user is someone who already has token usage data flowing into a monitoring system (Datadog, Grafana, Prometheus, or similar) and needs the AI to produce the alert logic, not just a vague recommendation. Required context includes historical token usage patterns, cost-per-token rates for the models in use, acceptable latency SLOs, and the team's on-call rotation structure.

Prompt
Context Budget Monitoring Alert Prompt Template
A practical prompt playbook for generating monitoring alert configurations, anomaly detection rules, and escalation paths from production token usage data.
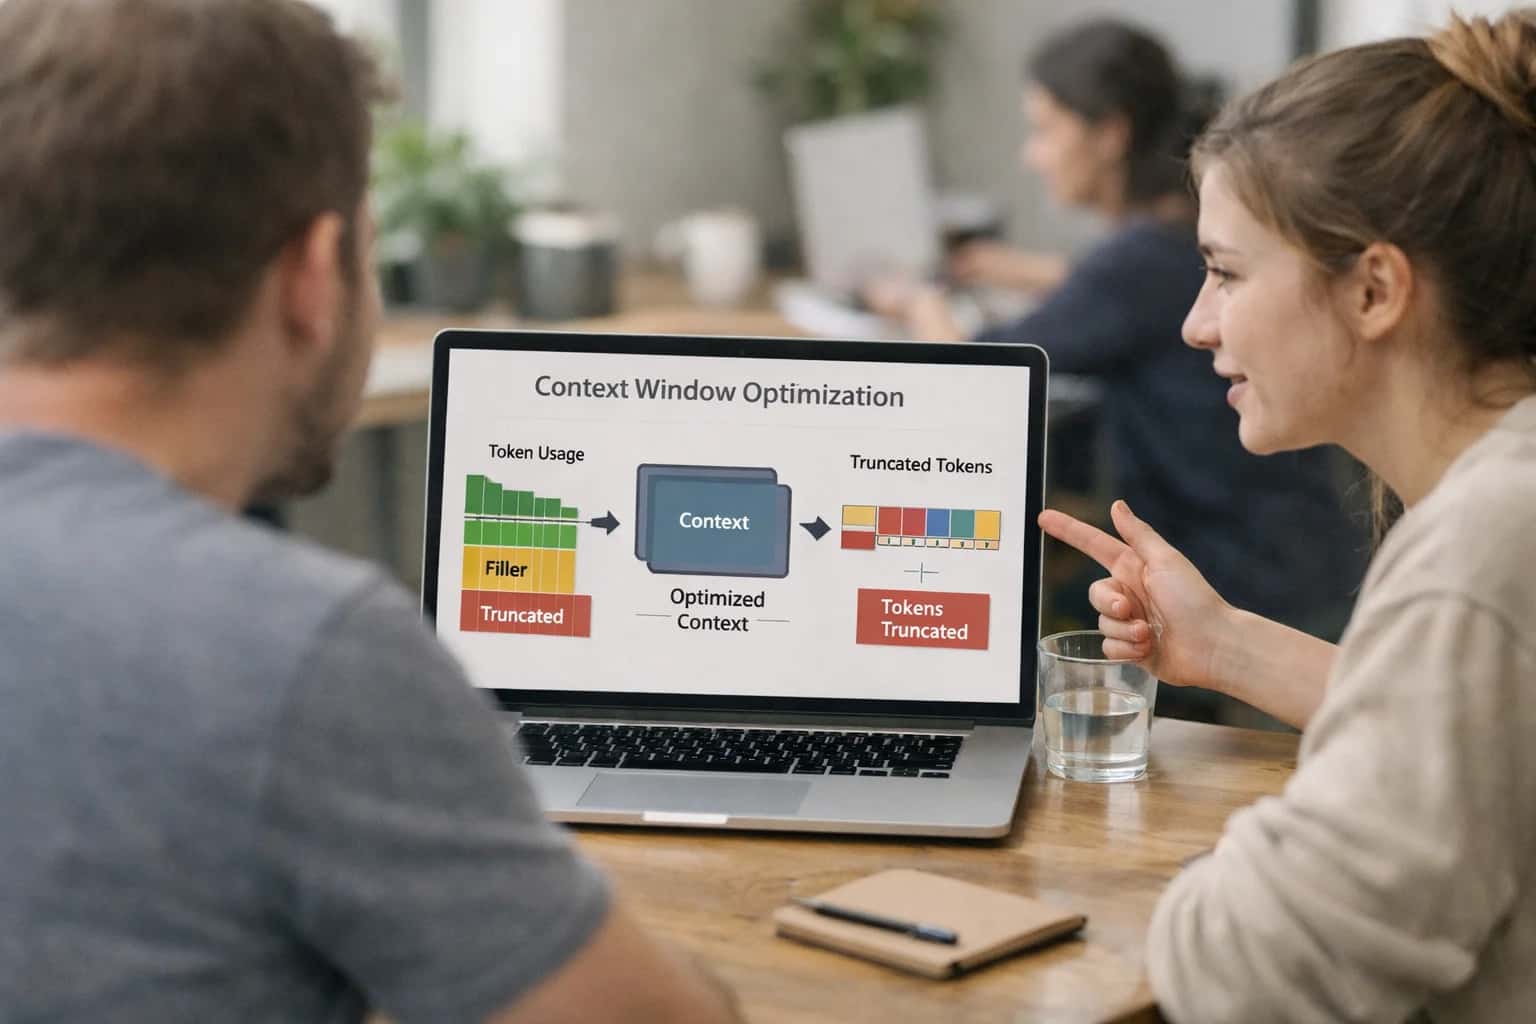
PROMPT PLAYBOOK
When to Use This Prompt
Define the job, reader, and constraints for the Context Budget Monitoring Alert Prompt Template.
Do not use this prompt when you lack historical usage data or when your monitoring stack cannot consume the output format. The prompt assumes you can provide concrete numbers—average tokens per request, p95 token counts, daily request volume, and cost per million tokens. If you are still in the exploration phase without production traffic, start with a simpler cost estimation prompt instead. Also avoid this prompt if your organization's alerting policies require manual approval for every threshold change; the output is designed for teams that can automate alert creation from structured configurations. For regulated environments where every alert must pass through a change advisory board, use this prompt to generate a draft for human review, not the final configuration.
The prompt produces a structured alert configuration document, not a real-time monitoring dashboard. It expects you to supply the data and integration points. Before using the output, validate that every threshold aligns with your actual budget and that escalation paths map to real on-call rotations. The next step after generating the alert config is to run it through a preflight check: simulate a token spike and verify the alert fires through the correct channel. If you skip this validation, you risk either alert fatigue from thresholds set too low or budget overruns from thresholds set too high.
PRACTICAL GUARDRAILS
Use Case Fit
Where the Context Budget Monitoring Alert Prompt Template delivers value and where it introduces operational risk.
01
Good Fit: Production AI Operations
Use when: you run multiple production prompts, need automated token-tracking alerts, and have dashboard or observability infrastructure. Guardrail: feed the prompt real token logs and threshold data; do not ask it to invent metrics.
02
Bad Fit: Ad-Hoc Prompt Experimentation
Avoid when: you are prototyping prompts without production traffic or logging. The template expects historical data and stable prompt versions. Guardrail: use manual token counters and cost estimators during experimentation; switch to this template only after you have consistent log data.
03
Required Inputs
What you must provide: token usage logs per prompt version, current context window limits, cost-per-token rates, and existing alerting channels. Guardrail: validate input freshness before each run; stale logs produce misleading thresholds.
04
Operational Risk: Alert Fatigue
Risk: overly sensitive thresholds generate noise and cause teams to ignore alerts. Guardrail: include hysteresis rules and anomaly detection windows in the prompt instructions; require the output to specify cooldown periods and escalation delays.
05
Operational Risk: Cost Blindness
Risk: token budget alerts that ignore cost multipliers across models can understate financial impact. Guardrail: require the prompt to produce cost-projected alerts, not just token-count thresholds; include model-specific pricing in the input context.
06
Integration Surface
Use when: you can pipe the generated alert config into Datadog, Grafana, PagerDuty, or a custom webhook. Guardrail: the prompt output must include machine-readable threshold values and escalation paths; validate the JSON schema before ingestion by your alerting system.
PROMPT PLAYBOOK
Copy-Ready Prompt Template
A reusable prompt for generating context budget monitoring alerts with configurable thresholds, anomaly detection rules, and escalation paths.
This template produces an alert configuration for monitoring token usage across production prompts. It takes historical usage data, cost constraints, and operational thresholds as input, then outputs a structured alert definition that can be wired into your observability stack. The prompt is designed to be adapted for different model providers, latency requirements, and escalation policies without rewriting the core logic.
codeYou are a production AI operations engineer responsible for context budget monitoring. Your task is to generate an alert configuration based on the provided usage data, thresholds, and operational constraints. ## INPUT DATA ### Historical Token Usage [USAGE_DATA] ### Cost Constraints - Maximum daily token budget: [DAILY_TOKEN_BUDGET] - Cost per 1K tokens (model-specific): [TOKEN_COST] - Budget overage tolerance (%): [OVERAGE_TOLERANCE] ### Operational Thresholds - Warning threshold (% of budget): [WARNING_THRESHOLD] - Critical threshold (% of budget): [CRITICAL_THRESHOLD] - Anomaly detection sensitivity: [ANOMALY_SENSITIVITY] - Evaluation window (hours): [EVALUATION_WINDOW] ### Escalation Path [ESCALATION_PATH] ### Dashboard Integration Points [DASHBOARD_ENDPOINTS] ## OUTPUT SCHEMA Generate a JSON alert configuration with this structure: { "alert_id": "string", "alert_name": "string", "alert_type": "threshold|anomaly|trend|composite", "conditions": [ { "metric": "token_count|cost|rate_of_change|per_request_avg", "operator": "gt|lt|outside_range|stddev_exceeds", "threshold_value": number, "evaluation_window_minutes": number, "sustained_periods": number } ], "anomaly_detection": { "method": "moving_average|stddev|percentile|seasonal_decompose", "training_window_hours": number, "sensitivity": number, "min_deviation_count": number, "excluded_patterns": ["string"] }, "escalation": { "warning_actions": ["string"], "critical_actions": ["string"], "auto_remediation": ["string"], "on_call_rotation": "string", "cooldown_minutes": number }, "dashboard_config": { "metric_panels": ["string"], "alert_overlay": boolean, "trend_line_days": number, "cost_projection_enabled": boolean }, "cost_trend_analysis": { "forecast_horizon_days": number, "seasonality_detection": boolean, "budget_exhaustion_estimate": "string", "optimization_suggestions": ["string"] }, "notification_channels": ["string"], "runbook_reference": "string" } ## CONSTRAINTS [CONSTRAINTS] ## EXAMPLES [EXAMPLES] Generate the alert configuration now. Return only valid JSON.
To adapt this template, replace each square-bracket placeholder with concrete values from your production environment. The [USAGE_DATA] field should contain a time-series of token counts, request volumes, and costs—typically pulled from your LLM proxy, observability platform, or API billing logs. If you lack historical data, replace [ANOMALY_SENSITIVITY] with a lower value and set anomaly_detection.method to moving_average rather than seasonal_decompose. The [ESCALATION_PATH] placeholder should map to your actual on-call rotation, pager service, or incident management tool. For teams without a dedicated escalation path, default to logging a critical event and posting to a shared Slack channel. Before deploying, validate the generated JSON against your alerting system's schema and run a dry-fire test with synthetic usage data that crosses each threshold.
IMPLEMENTATION TABLE
Prompt Variables
Required inputs for the context budget monitoring alert prompt. Each variable must be validated before prompt assembly to prevent runtime failures or false alerts.
| Placeholder | Purpose | Example | Validation Notes |
|---|---|---|---|
[CURRENT_TOKEN_USAGE] | Real-time token consumption data from production inference logs | {"prompt_tokens": 12450, "completion_tokens": 2300, "total_tokens": 14750, "model": "gpt-4-turbo", "timestamp": "2025-01-15T14:32:00Z"} | Schema check: must include prompt_tokens, completion_tokens, total_tokens, model, timestamp. Null not allowed. Parse as JSON object. |
[BUDGET_THRESHOLD] | Maximum allowed token budget per request or session | {"max_total_tokens": 16000, "max_prompt_tokens": 12000, "warning_threshold_pct": 0.85, "critical_threshold_pct": 0.95} | Schema check: must include max_total_tokens and at least one threshold percentage. Warning threshold must be less than critical threshold. Null not allowed. |
[HISTORICAL_USAGE_WINDOW] | Rolling window of recent token usage for trend and anomaly detection | [{"total_tokens": 14200, "timestamp": "2025-01-15T14:00:00Z"}, {"total_tokens": 15100, "timestamp": "2025-01-15T14:15:00Z"}] | Array check: minimum 3 data points required for trend calculation. Each entry must have total_tokens and timestamp. Null allowed if no history exists; triggers baseline-only alert mode. |
[ALERT_CONFIGURATION] | Alert severity levels, notification channels, and escalation rules | {"channels": ["slack", "pagerduty"], "severity_levels": ["warning", "critical"], "escalation_delay_minutes": 15, "cooldown_minutes": 30} | Schema check: channels must be non-empty array. escalation_delay_minutes must be positive integer. cooldown_minutes must be greater than escalation_delay_minutes. Null not allowed. |
[MODEL_PRICING_TABLE] | Cost per token by model for cost projection calculations | {"gpt-4-turbo": {"prompt_cost_per_1k": 0.01, "completion_cost_per_1k": 0.03}, "claude-3-opus": {"prompt_cost_per_1k": 0.015, "completion_cost_per_1k": 0.075}} | Schema check: keys must match model identifiers in CURRENT_TOKEN_USAGE. Each entry must have prompt_cost_per_1k and completion_cost_per_1k as positive floats. Null allowed if cost projection is disabled. |
[DASHBOARD_INTEGRATION_POINT] | Target dashboard or monitoring system endpoint for alert delivery | {"type": "grafana_annotation", "endpoint": "https://monitoring.internal/api/annotations", "api_key_env": "GRAFANA_API_KEY", "tags": ["token-budget", "production"]} | Schema check: type must be one of grafana_annotation, datadog_event, custom_webhook. endpoint must be valid URL. api_key_env must reference an environment variable name. Null allowed if dashboard integration is disabled. |
[ANOMALY_DETECTION_RULES] | Rules defining what constitutes an anomalous usage spike or pattern | {"spike_threshold_pct": 50, "rolling_window_size": 6, "min_deviation_std": 2.0, "ignore_below_absolute_tokens": 500} | Schema check: spike_threshold_pct must be positive float. rolling_window_size must be integer >= 3. min_deviation_std must be >= 1.0. Null allowed; disables anomaly detection and falls back to threshold-only alerting. |
[ESCALATION_CONTACTS] | On-call contacts and team routing for critical alerts | {"primary": "eng-team@company.com", "secondary": "sre-oncall@company.com", "slack_channel": "#alerts-token-budget", "pagerduty_service_id": "P123ABC"} | Schema check: at least one contact method required when alert severity is critical. Email fields must match email regex. pagerduty_service_id must be non-empty string if pagerduty is in ALERT_CONFIGURATION channels. Null allowed for warning-only configurations. |
PROMPT PLAYBOOK
Implementation Harness Notes
How to wire the context budget monitoring alert prompt into a production observability pipeline.
This prompt is designed to run as a scheduled or event-driven analysis step inside your AI observability stack, not as a one-off chat interaction. The primary integration point is your existing prompt logging or tracing system (e.g., LangSmith, Braintrust, Weights & Biases, or a custom logging middleware). The harness should collect raw token usage data per-request, aggregate it by prompt template ID and time window, and feed the aggregated statistics into this prompt as [CONTEXT]. The prompt then produces an alert configuration document that your monitoring system (e.g., PagerDuty, Grafana, Datadog) can consume or that a human operator reviews before activating.
The implementation requires three stages: data collection, prompt execution, and alert activation. For data collection, instrument your LLM calls to log prompt_template_id, timestamp, input_tokens, output_tokens, total_tokens, and model_id to a structured store. Aggregate these into hourly or daily buckets with mean, p95, p99, and max token counts per template. This aggregated summary becomes the [CONTEXT] input. For prompt execution, wrap the call in a retry handler with at least 3 retries on malformed JSON output, using a strict JSON schema validator (e.g., Pydantic or Zod) that checks for required fields like alert_name, thresholds, anomaly_rules, and escalation_path. If validation fails after retries, log the raw output and escalate to a human operator—do not silently discard. For alert activation, parse the validated output and upsert the thresholds into your monitoring system's configuration API. Never auto-activate alerts that trigger paging without human review on the first deployment; use a dry-run mode that logs what would have fired for at least one full business cycle.
Model choice matters here. Use a model with strong JSON-following behavior and low refusal rates on operational content. GPT-4o, Claude 3.5 Sonnet, and Gemini 1.5 Pro are all suitable. Avoid models under 7B parameters unless you've validated their schema adherence on this specific task. Set temperature=0 or very low (≤0.1) to maximize output determinism. If your monitoring system expects a specific alert format (e.g., Datadog monitor JSON, Prometheus alerting rules), include that schema as [OUTPUT_SCHEMA] in the prompt. For teams running high-volume inference, consider caching the prompt prefix (the system message and static instructions) to reduce per-call token costs. Finally, log every execution—input context, raw output, validation result, and activation decision—with a unique execution_id so you can trace any misconfigured alert back to the prompt run that generated it.
IMPLEMENTATION TABLE
Expected Output Contract
Fields, types, and validation rules for the alert configuration object produced by the Context Budget Monitoring Alert Prompt. Use this contract to parse and validate the model output before ingesting it into your monitoring dashboard or alerting pipeline.
| Field or Element | Type or Format | Required | Validation Rule |
|---|---|---|---|
alert_name | string | Must match pattern ^[a-z0-9_-]+$. Max 64 characters. No markdown. | |
alert_type | enum: threshold | anomaly | trend | cost_spike | Must be one of the four listed enum values. Case-sensitive. | |
target_context | string | Must reference a valid prompt or pipeline identifier from the provided [PROMPT_REGISTRY]. | |
threshold_config | object | Must contain token_limit (integer) and direction (enum: above | below). token_limit must be > 0. | |
evaluation_window | string | Must be a valid ISO 8601 duration string (e.g., PT5M, PT1H). Minimum window is PT1M. | |
severity | enum: critical | warning | info | Must be one of the three listed enum values. Default to warning if confidence is below 0.9. | |
escalation_policy | object | Must contain channel (enum: slack | pagerduty | email | webhook) and recipients (array of strings, min 1 item). | |
dashboard_link | string (URI) | If present, must be a valid absolute URI. Reject relative paths. Null allowed. |
PRACTICAL GUARDRAILS
Common Failure Modes
What breaks first when monitoring context budgets in production and how to guard against it.
01
Silent Budget Overruns
What to watch: Prompts exceed the context window without throwing an error, causing silent truncation from the middle of the assembled prompt. Critical instructions or evidence get dropped before inference. Guardrail: Implement a preflight token counter that validates the assembled prompt against the model's context limit and rejects requests that exceed a configurable threshold (e.g., 95% of max tokens).
02
Alert Threshold Drift
What to watch: Static alert thresholds become stale as model context windows expand, prompt templates change, or usage patterns shift. Alerts either fire constantly (alert fatigue) or never fire (missed overruns). Guardrail: Tie alert thresholds to dynamic baselines calculated from rolling 7-day average token consumption per endpoint, with anomaly detection on deviations exceeding 2 standard deviations.
03
Cost Spike Blindness
What to watch: Token usage grows gradually across prompt versions without triggering a single threshold breach, causing 3x cost increases over a month that go unnoticed. Guardrail: Add cost trend analysis to monitoring dashboards that compares week-over-week token consumption and estimated spend, with alerts on cumulative growth exceeding 20% per sprint.
04
Conversation History Bloat
What to watch: Multi-turn sessions accumulate unbounded conversation history, consuming 80%+ of the context window and starving instructions and evidence. Guardrail: Monitor the ratio of conversation tokens to total prompt tokens per request. Trigger a summarization or pruning step when conversation history exceeds 60% of the allocated budget.
05
Tool Result Flooding
What to watch: Agent workflows return large tool outputs (e.g., full API responses, file contents) that consume the remaining context budget, leaving no room for reasoning or final output generation. Guardrail: Enforce per-tool output size limits and implement a tool result summarization step when cumulative tool output exceeds 40% of the remaining context window.
06
Escalation Path Gaps
What to watch: Alerts fire but no one owns the response. Budget overruns persist for days because escalation rules are undefined or point to inactive channels. Guardrail: Define explicit escalation paths in the alert configuration: first responder (on-call engineer), escalation contact (platform lead), and auto-remediation action (e.g., fallback to smaller model) with SLAs for acknowledgment and resolution.
IMPLEMENTATION TABLE
Evaluation Rubric
Use this rubric to evaluate the quality of alert configurations produced by the Context Budget Monitoring Alert Prompt Template before deploying them to production monitoring systems.
| Criterion | Pass Standard | Failure Signal | Test Method |
|---|---|---|---|
Threshold Accuracy | All token thresholds match the specified [BUDGET_LIMITS] and [MODEL_CONTEXT_WINDOW] values exactly | Threshold values are off by more than 1% from specified limits or use wrong units | Parse the output JSON and compare each threshold field against the input [BUDGET_LIMITS] schema using automated diff check |
Anomaly Detection Rule Completeness | At least one anomaly rule is defined for each metric in [MONITORED_METRICS] with a valid condition expression | Missing rules for any monitored metric or condition expressions that fail to parse in the target monitoring system | Count unique metric references in anomaly rules and cross-reference against [MONITORED_METRICS] list; validate condition syntax against monitoring system grammar |
Escalation Path Validity | Every alert severity level maps to at least one escalation step with a defined [ESCALATION_CHANNEL] and response time | Orphaned severity levels with no escalation target or channels that don't match allowed [ESCALATION_CHANNEL] values | Extract all severity-to-channel mappings and verify each channel exists in the allowed [ESCALATION_CHANNEL] enum; check response time fields are non-null |
Dashboard Integration Point Format | Each integration point includes a valid dashboard URL template, metric name, and refresh interval matching [DASHBOARD_CONFIG] | Missing URL templates, metric names that don't appear in [MONITORED_METRICS], or refresh intervals outside allowed range | Validate URL templates contain required placeholder tokens; cross-reference metric names against input; check refresh intervals against [DASHBOARD_CONFIG] constraints |
Cost Trend Analysis Configuration | Cost trend section includes at least one projection rule with a lookback window, forecast horizon, and cost model reference from [COST_MODEL] | Empty projection rules, lookback windows exceeding data retention limits, or references to undefined cost models | Verify projection rules array is non-empty; validate lookback windows against [DATA_RETENTION_DAYS]; confirm all cost model references resolve to keys in [COST_MODEL] |
Output Schema Compliance | The entire output validates against the [OUTPUT_SCHEMA] with zero schema violations | Missing required fields, wrong types, or extra fields not defined in the schema | Run automated JSON Schema validation using the provided [OUTPUT_SCHEMA]; fail on any validation errors |
Alert Naming Convention Adherence | All alert names follow the pattern defined in [NAMING_CONVENTION] with correct environment and service tags | Alert names missing required tags, using unsupported environment values, or deviating from the specified pattern | Apply regex validation using the pattern from [NAMING_CONVENTION] against every alert name in the output |
Threshold Breach Simulation Readiness | Each threshold alert includes a test scenario with expected trigger condition and sample payload that would breach the threshold | Missing test scenarios, scenarios that wouldn't actually trigger the alert, or sample payloads with invalid data types | For each alert, simulate the test scenario against the threshold condition using a unit test harness; verify the condition evaluates to true |
Enabling Efficiency, Speed & Accuracy
Intelligent Analysis, Decision & Execution
We build AI systems for teams that need search across company data, workflow automation across tools, or AI features inside products and internal software.
Talk to Us
Search across company data
Give teams answers from docs, tickets, runbooks, and product data with sources and permissions.
Useful when people spend too long searching or get different answers from different systems.
Enterprise searchRAGPermissions
Read more
Automate internal workflows
Use AI to route work, draft outputs, trigger actions, and keep approvals and logs in place.
Useful when repetitive work moves across multiple tools and teams.
AI agentsWorkflow automationGovernance
Read more
Add AI to products and internal tools
Build assistants, guided actions, or decision support into the software your team or customers already use.
Useful when AI needs to be part of the product, not a separate tool.
AI integrationDecision supportModel routing
Read moreADAPTATION OPTIONS
Adapt This Prompt
How to adapt
Start with the base alert template and a single threshold rule. Use a simple JSON output schema without strict enum validation. Run the prompt against a static sample of recent token logs to see if it catches obvious spikes.
code[SYSTEM]: You are a context budget monitor. Review the following token usage log and flag any request where [TOKEN_THRESHOLD] is exceeded. Return a JSON array of alerts.
Watch for
- Overly sensitive thresholds that fire on normal variance
- Missing baseline data causing false positives
- No distinction between warning and critical severity

About the author
Prasad Kumkar
CEO & MD, Inference Systems
Prasad Kumkar is the CEO & MD of Inference Systems and writes about AI systems architecture, LLM infrastructure, model serving, evaluation, and production deployment. Over 5+ years, he has worked across computer vision models, L5 autonomous vehicle systems, and LLM research, with a focus on taking complex AI ideas into real-world engineering systems.
His work and writing cover AI systems, large language models, AI agents, multimodal systems, autonomous systems, inference optimization, RAG, evaluation, and production AI engineering.
LinkedIn
Limited slotsGet a Free AI Consultation
Partnered with leading AI, data, and software stack.





How We Work
Custom AI workflows for your Business
One-fit-all AI don't work for modern businesses. At Inferensys, we aim to understand your business & custom requirements; which we use to define most efficient agentic workflows, the data, and the tools for your business.
01
Review the use case
We understand the task, the users, and where AI can actually help.
Read more02
Pick the right approach
We define what needs search, automation, or product integration.
Read more03
Build the first useful version
We implement the part that proves the value first.
Read more04
Improve from there
We add the checks and visibility needed to keep it useful.
Read moreThe first call is a practical review of your use case and the right next step.
Talk to Us