Use this prompt when an incident is active or under post-incident review and you suspect a recent pipeline event—such as a failed build, flaky test regression, artifact change, or deployment rollback—may be a contributing factor or early signal. The ideal user is a DevOps engineer, SRE, or on-call responder who has access to a structured incident window and a list of pipeline events from systems like Jenkins, GitHub Actions, GitLab CI, or Spinnaker, but lacks the time to manually cross-reference every event against the incident timeline. The prompt ingests these two datasets and outputs a ranked list of pipeline events correlated with the incident, each with a correlation strength score, evidence summary, and a recommended action.

Prompt
CI/CD Pipeline Failure Correlation Prompt
A practical prompt playbook for correlating CI/CD pipeline failures, artifact changes, test regressions, and deployment timing with an active incident window. Designed for DevOps and SRE teams who need ranked, evidence-backed pipeline event lists to accelerate root cause analysis.
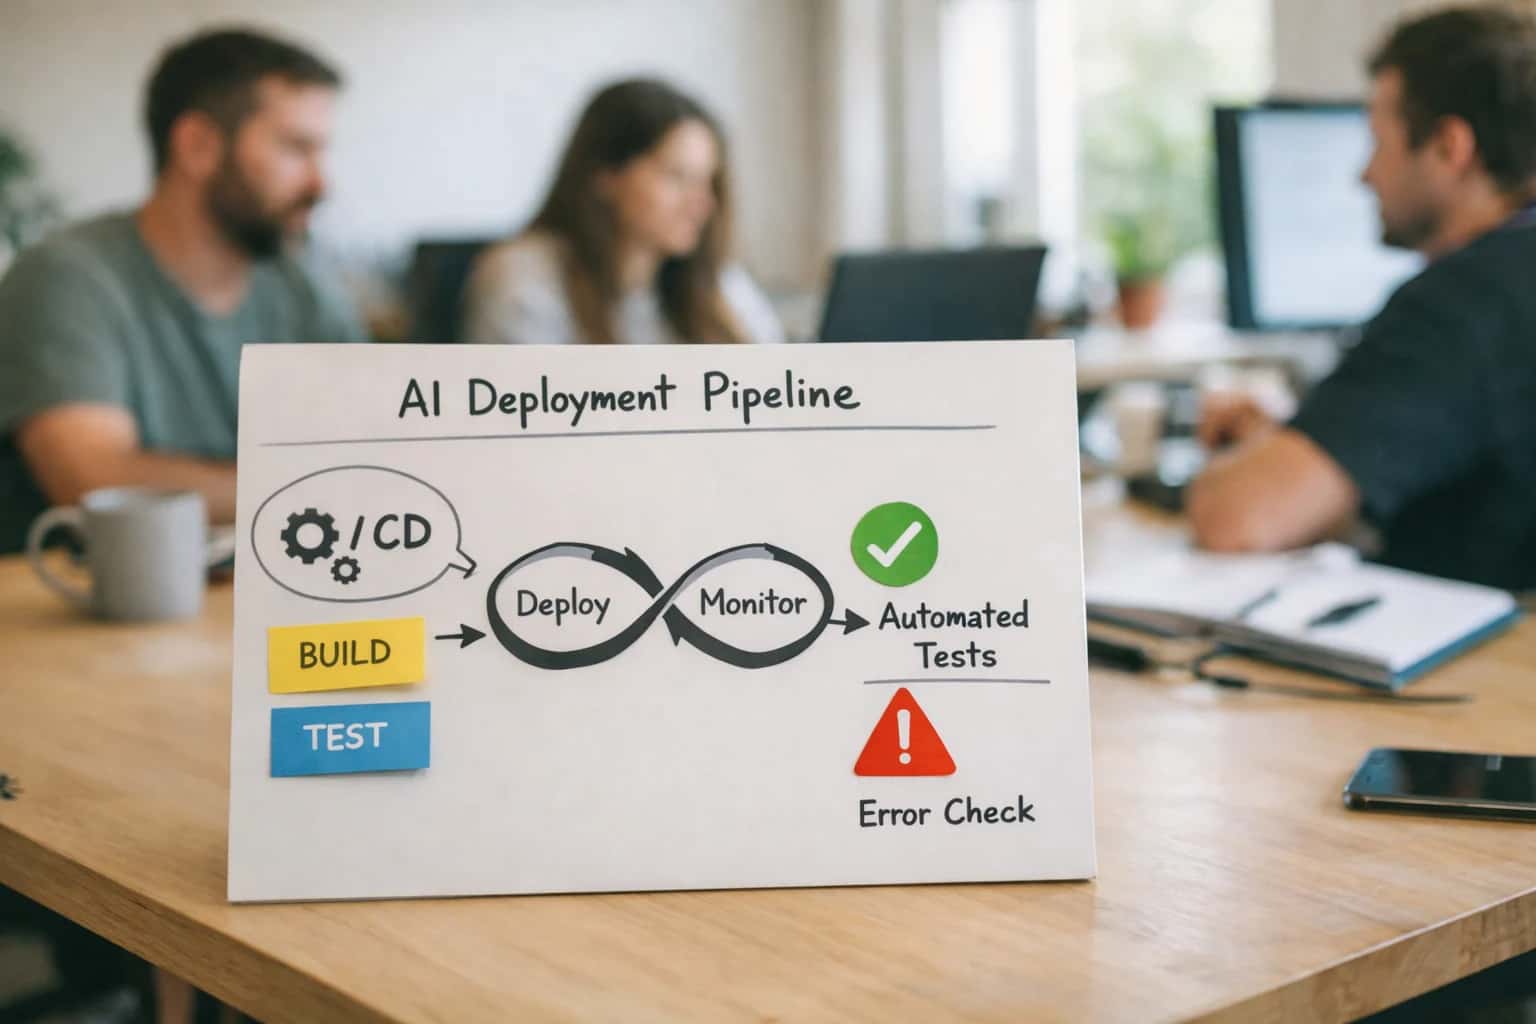
PROMPT PLAYBOOK
When to Use This Prompt
A reasoning accelerator for on-call engineers to connect scattered pipeline activity to active production incidents.
This prompt is not a replacement for metric dashboards, distributed tracing tools, or log aggregation platforms. It does not perform real-time monitoring or execute diagnostic commands. Instead, it acts as a reasoning accelerator that helps you quickly narrow a large set of pipeline events to the few most likely to be relevant. You should use it when the incident's symptoms suggest a deployment-related cause—such as a sudden spike in errors immediately following a release—but the exact trigger is unclear because dozens of pipeline events occurred in the same window. The prompt requires a well-formed [INCIDENT_WINDOW] with a start time, end time, and symptom summary, and a [PIPELINE_EVENTS] list containing timestamps, event types, statuses, and artifact or change identifiers.
Do not use this prompt when the incident is clearly unrelated to CI/CD activity—for example, a pure infrastructure failure like a network partition or a third-party outage with no recent deployments. Do not use it as a substitute for a postmortem process; it provides correlation hypotheses, not a definitive root cause. Always validate the output against your observability data before taking action, especially for high-severity incidents where a rollback or hotfix decision carries significant risk. The next section provides the exact prompt template you can copy and adapt for your environment.
PRACTICAL GUARDRAILS
Use Case Fit
Where this prompt works, where it fails, and the operational preconditions required before wiring it into an incident response workflow.
01
Good Fit: Structured CI/CD Event Streams
Use when: your pipeline emits structured events (build failures, test regressions, artifact changes, deployment timestamps) into a queryable system. The prompt excels at correlating timestamped, machine-generated records against an incident window. Guardrail: pre-normalize event schemas before feeding them to the prompt; inconsistent field names across Jenkins, GitHub Actions, and Spinnaker degrade correlation accuracy.
02
Bad Fit: Unstructured Chat or Manual Deployments
Avoid when: pipeline failure evidence lives only in Slack threads, manual SSH session logs, or tribal knowledge. The prompt requires structured event data to correlate; it cannot reconstruct deployment history from conversational context. Guardrail: if manual deployments are common, enforce a deployment journal or annotated git tag convention before relying on this prompt for incident analysis.
03
Required Inputs: Incident Window and Event Corpus
What to watch: the prompt needs a precise incident start time, a bounded correlation window, and a deduplicated event corpus. Missing or fuzzy timestamps produce spurious correlations. Guardrail: validate that every pipeline event includes a UTC timestamp, a pipeline identifier, and a commit SHA before calling the prompt. Reject events with clock skew exceeding 30 seconds.
04
Operational Risk: Confirmation Bias in Ranking
What to watch: the model may over-rank recent or high-severity pipeline failures even when they are unrelated to the incident. This creates confirmation bias where the most visible failure is mistaken for the root cause. Guardrail: require the prompt to output a confidence score per correlation and flag events where temporal proximity is the only linking evidence. Human review must confirm the top-ranked candidate before remediation begins.
05
Operational Risk: Incomplete Event Coverage
What to watch: if a pipeline system (e.g., a canary deployment tool) does not emit events into the correlation corpus, the prompt cannot consider it. The output will be silently incomplete rather than explicitly uncertain. Guardrail: maintain a pipeline inventory and assert that every registered pipeline contributed events to the correlation window. If a pipeline is missing, the prompt output must include a coverage gap warning.
06
Operational Risk: Deployment vs. Symptom Confusion
What to watch: a pipeline failure may be a symptom of the same underlying cause as the incident (e.g., network partition) rather than a contributor. The prompt may incorrectly rank it as causal. Guardrail: include infrastructure health signals (network status, node availability) alongside pipeline events so the prompt can distinguish shared-cause symptoms from independent failures.
PROMPT PLAYBOOK
Copy-Ready Prompt Template
A copy-ready prompt for correlating CI/CD pipeline events with an active incident window to identify contributing deployments, test regressions, and artifact changes.
The following prompt template is designed to be pasted directly into your AI harness. It instructs the model to act as a DevOps correlation analyst, ingesting structured data about a CI/CD pipeline and an incident to produce a ranked, evidence-backed list of suspect events. Before using this prompt, you must populate the square-bracket placeholders with real data from your pipeline, monitoring, and incident management systems. The prompt enforces a strict output schema, requires evidence for every correlation, and explicitly instructs the model to state when data is missing or inconclusive—preventing confident but unsupported assertions.
textYou are a DevOps correlation analyst. Your task is to correlate CI/CD pipeline events with an active incident window to identify which pipeline events may have contributed to or signaled the incident. ## INCIDENT CONTEXT - Incident ID: [INCIDENT_ID] - Incident Start Time: [INCIDENT_START_TIME] - Incident End Time: [INCIDENT_END_TIME] (or 'ongoing') - Incident Severity: [INCIDENT_SEVERITY] - Primary Symptom: [PRIMARY_SYMPTOM] - Affected Services: [AFFECTED_SERVICES] ## PIPELINE DATA A JSON array of pipeline events that occurred within a 4-hour window before and during the incident. Each event has the following structure: [PIPELINE_EVENTS_JSON] ## CONSTRAINTS - Rank events by likelihood of contribution to the incident, not just by temporal proximity. - For each ranked event, provide specific evidence from the pipeline data (e.g., test failure names, artifact diff summaries, deployment target). - If an event's relationship to the incident is unclear, state the uncertainty explicitly and suggest what additional data would resolve it. - Do not fabricate causal links. If the data is insufficient to connect an event to the incident, place it in an 'Inconclusive' section. - Consider the following correlation signals: - Temporal proximity to incident start. - Test regressions that match the incident symptom. - Deployment of services listed in AFFECTED_SERVICES. - Artifact or configuration changes to incident-related components. - Failed or rolled-back deployments. ## OUTPUT SCHEMA Return a single JSON object with the following structure. Do not include any text outside the JSON object. { "incident_id": "string", "correlation_window": "string (human-readable time range analyzed)", "total_events_analyzed": "number", "ranked_suspect_events": [ { "rank": "number", "pipeline_event_id": "string", "event_type": "string (e.g., deployment, test_run, artifact_publish, rollback)", "correlation_strength": "high | medium | low", "evidence": ["string (specific evidence from pipeline data)"], "hypothesis": "string (how this event could explain the incident symptom)", "confidence": "number (0.0 to 1.0)" } ], "inconclusive_events": [ { "pipeline_event_id": "string", "reason": "string (why correlation could not be determined)", "missing_data": ["string (what data would help resolve this)"] } ], "overall_assessment": "string (summary of findings and recommended next steps)" }
To adapt this prompt for your environment, replace the placeholders with live data. The [PIPELINE_EVENTS_JSON] placeholder expects a JSON array of objects, each containing at minimum an id, timestamp, type, status, and details field. You can enrich this with deployment targets, test suite results, artifact SHAs, and configuration diffs. The more structured data you provide, the more precise the correlation will be. If your pipeline data is spread across multiple systems (e.g., Jenkins for CI, ArgoCD for CD, a separate test reporting tool), aggregate and normalize it into the expected JSON structure before calling the prompt. For high-severity incidents where a wrong correlation could misdirect the response team, route the model's output to a human reviewer before acting on the ranked list. Implement a validation step that checks the output JSON against the schema and rejects malformed responses, triggering a retry with a stricter format reminder.
IMPLEMENTATION TABLE
Prompt Variables
Every placeholder the CI/CD Pipeline Failure Correlation Prompt expects, why it matters, and how to validate it before sending the prompt.
| Placeholder | Purpose | Example | Validation Notes |
|---|---|---|---|
[INCIDENT_TIMELINE] | Normalized event log with timestamps, event types, and sources from the incident window. | 2025-01-15T14:03:22Z | alert_fired | latency_p99>500ms | prometheus-us-east | Must contain at least 5 events with ISO-8601 timestamps. Reject if timestamps are non-sequential or span less than 5 minutes. |
[PIPELINE_RUNS] | List of CI/CD pipeline executions with status, duration, commit SHA, branch, and trigger source for the 24 hours surrounding the incident. | run_id: 8472 | status: failed | duration: 3m12s | commit: a1b2c3d | branch: main | trigger: push | Must include all runs from 24h before incident start to incident resolution. Reject if fewer than 3 runs exist or if status field is missing for any run. |
[ARTIFACT_CHANGES] | Diffs of build artifacts, container images, or binary hashes between the last successful pre-incident pipeline and the first failing pipeline. | image: app:v2.4.1 -> v2.4.2 | diff: libssl.so.3 added | size_delta: +1.2MB | Must include at least one artifact change entry. Reject if all entries are null or if artifact version strings are identical across the comparison window. |
[TEST_REGRESSIONS] | Structured list of test cases that passed in the prior pipeline run but failed in a run within the incident window, including test name, suite, and failure message. | test: AuthServiceTest.login_timeout | suite: integration | error: connection refused after 5000ms | Must include test name and failure message. Reject if all entries show 'passed' status or if failure messages are empty strings. |
[DEPLOYMENT_EVENTS] | Deployment records with target environment, version, start time, completion time, and status for any deployment overlapping the incident window. | env: production-us-east | version: v2.4.2 | start: 14:01:00Z | end: 14:04:30Z | status: completed | Must include at least one deployment event. Reject if deployment start time is after incident resolution or if environment field is missing. |
[SERVICE_DEPENDENCY_MAP] | Graph or list of service dependencies showing upstream and downstream relationships for services mentioned in pipeline or incident data. | service: api-gateway | depends_on: [auth-service, rate-limiter] | depended_by: [web-app, mobile-api] | Must include all services referenced in [PIPELINE_RUNS] and [INCIDENT_TIMELINE]. Reject if any referenced service has no dependency entry. |
[CORRELATION_WINDOW] | Time range for correlation analysis, typically from 1 hour before incident start to incident resolution. | start: 2025-01-15T13:00:00Z | end: 2025-01-15T15:30:00Z | Must be a valid closed interval where start < end. Reject if window exceeds 48 hours or if start is after end. |
[OUTPUT_SCHEMA] | Expected JSON schema for the ranked correlation output, defining fields for pipeline event, correlation strength, evidence, and confidence. | See output-contract table for full schema definition. | Must be a valid JSON Schema draft-07 object. Reject if schema is missing required fields or contains circular references. |
PROMPT PLAYBOOK
Implementation Harness Notes
How to wire the CI/CD Pipeline Failure Correlation Prompt into an incident response bot, postmortem pipeline, or manual investigation CLI tool.
This prompt is designed to be called from an automated incident response bot, a postmortem generation pipeline, or a manual investigation CLI tool. The calling application is responsible for gathering and normalizing the raw data before invoking the model. Pre-process pipeline events from your CI/CD system—such as Jenkins, GitHub Actions, GitLab CI, CircleCI, or Spinnaker—into the JSON schema defined in the Output Contract section. Normalize all timestamps to UTC before calling the prompt to ensure consistent correlation with the incident window. The application should construct the final prompt by injecting the pre-processed pipeline events, the incident window, and any relevant deployment change records into the [INPUT] placeholder.
After the model returns a response, the application must validate the output against the expected JSON schema using a strict validator. If the model returns malformed JSON, implement a retry with exponential backoff (e.g., 1s, 2s, 4s delays) before re-invoking the prompt. If the model returns a correlation with a confidence score below 0.5, suppress that item from the final output and log it separately for offline review by the on-call team. For high-severity incidents, require a human to explicitly confirm any correlation marked as likely_root_cause before it is written into the postmortem document. Always log the full prompt and the raw model response for auditability, storing them alongside the incident record.
Choose a model with strong JSON mode and instruction-following capabilities for this workflow. Avoid models that are prone to hallucinating timestamps or fabricating pipeline event details. The prompt does not require tool use or retrieval-augmented generation (RAG) because all necessary context is injected at call time. The primary failure mode in production is the model proposing a correlation that is chronologically impossible (e.g., a pipeline failure after the incident was already resolved). Mitigate this by adding a post-processing rule that discards any correlation where the pipeline event timestamp falls outside the incident window. Do not pass unvalidated model output directly to downstream systems like ticketing tools or status pages.
IMPLEMENTATION TABLE
Expected Output Contract
Validate the model response against this schema before accepting it. Any field marked Required: true must be present and pass its validation rule. Reject or repair responses that fail validation.
| Field or Element | Type or Format | Required | Validation Rule |
|---|---|---|---|
correlation_id | string (UUID v4) | Must match the request correlation_id. Reject on mismatch. | |
incident_window | object | Must contain start_utc and end_utc as ISO 8601 strings. Start must be before end. | |
pipeline_events | array of objects | Array length must be >= 1. Each object must pass the pipeline_event schema check below. | |
pipeline_events[].pipeline_name | string | Non-empty string. Must match a known pipeline identifier from the provided [PIPELINE_CATALOG]. | |
pipeline_events[].event_type | enum: build_failure, test_regression, artifact_change, deployment_start, deployment_rollback, config_change, dependency_update, timeout, flaky_test_surge, unknown | Must be one of the enumerated values. Reject unknown values not in the enum. | |
pipeline_events[].timestamp_utc | string (ISO 8601) | Must parse as valid ISO 8601 UTC datetime. Must fall within or within 60 minutes before the incident_window.start_utc. | |
pipeline_events[].correlation_score | number (0.0 to 1.0) | Must be a float between 0.0 and 1.0 inclusive. Parse and range-check. Higher score means stronger correlation with the incident. | |
pipeline_events[].evidence_summary | string | Non-empty string between 20 and 500 characters. Must reference at least one specific artifact, test name, commit SHA, or config key from the provided [PIPELINE_DATA]. | |
pipeline_events[].suspect_artifact | object or null | If present, must contain artifact_name (string), artifact_version (string), and change_type (enum: added, modified, removed). If null, no artifact change is associated. | |
pipeline_events[].test_regression_details | object or null | If event_type is test_regression or flaky_test_surge, this field is required. Must contain failed_test_count (integer >= 1) and example_failing_tests (array of strings, length 1-10). Otherwise, must be null. | |
ranked_causes | array of objects | Array length must be >= 1 and <= 10. Sorted descending by likelihood_score. Each object must pass the ranked_cause schema check. | |
ranked_causes[].rank | integer | Sequential integer starting at 1. Must match the array index + 1. | |
ranked_causes[].pipeline_event_index | integer | Must be a valid index into the pipeline_events array (0-based). Reject if out of bounds. | |
ranked_causes[].hypothesis | string | Non-empty string between 30 and 300 characters. Must state a causal relationship between the pipeline event and the incident symptom. | |
ranked_causes[].likelihood_score | number (0.0 to 1.0) | Float between 0.0 and 1.0 inclusive. Must be <= the correlation_score of the referenced pipeline_event. | |
ranked_causes[].testable_statement | string | Non-empty string between 20 and 200 characters. Must be phrased as a falsifiable claim that can be verified by checking logs, metrics, or code. | |
confidence_note | string or null | If any correlation_score < 0.5, this field is required and must explain the uncertainty. Otherwise, may be null. |
PRACTICAL GUARDRAILS
Common Failure Modes
What breaks first when correlating CI/CD pipeline failures with incidents, and how to guard against it.
01
Phantom Correlation from Timestamp Coincidence
What to watch: The model flags pipeline failures that happened near the incident window but have no causal link. A flaky test that failed three hours before the incident gets ranked as a top suspect simply because timestamps overlap. Guardrail: Require the prompt to distinguish temporal proximity from causal connection. Add a [CAUSAL_EVIDENCE] field in the output schema that forces the model to articulate the mechanism linking the pipeline event to the incident symptom before ranking it.
02
Missing Deployment Events Outside the Primary Pipeline
What to watch: The prompt only analyzes the main CI/CD pipeline and misses critical changes from side channels—feature flag toggles, config pushes, manual hotfixes, or infrastructure-as-code apply runs that bypass the standard pipeline. Guardrail: Expand the input context to include [DEPLOYMENT_AUDIT_LOG] and [FEATURE_FLAG_CHANGE_LOG] alongside pipeline data. Add an eval check that verifies the prompt explicitly considered non-pipeline change sources before finalizing its ranking.
03
Test Regression Misattribution
What to watch: A test that started failing in the incident window is assumed to signal the root cause, but the test failure is actually a symptom of the same underlying issue—or the test was already flaky and its failure is unrelated noise. Guardrail: Include [HISTORICAL_TEST_FLAKINESS] data in the prompt input. Instruct the model to down-rank tests with a known flaky history and to distinguish between tests that detect the incident versus tests that are broken by the incident.
04
Artifact Drift Without Code Change
What to watch: The model attributes a failure to a code diff when the real cause is an artifact change—a new base image, an updated dependency resolved at build time, or a cached layer that changed between runs with no code modification. Guardrail: Require the prompt to compare [BUILD_ARTIFACT_MANIFEST] between the last known good build and the suspect build. Add a specific output field for artifact_drift_findings that captures dependency version shifts, base image digest changes, and cache invalidation events.
05
Confidence Inflation on Sparse Evidence
What to watch: When pipeline data is incomplete—missing logs, truncated error messages, or gaps in the deployment timeline—the model still produces high-confidence rankings instead of flagging uncertainty. Guardrail: Add a [DATA_COMPLETENESS] input field that describes what data is available and what is missing. Instruct the model to produce a confidence score per finding and to downgrade confidence when key data sources are absent. Add an eval that verifies low-confidence outputs correlate with known data gaps.
06
Ranking Reversal from Prompt Instability
What to watch: Slight rephrasing of the incident description or reordering of pipeline events causes the model to flip its top-ranked suspect, making the output unreliable for on-call decision-making. Guardrail: Add a [RANKING_STABILITY] constraint in the prompt that requires the model to explain why its top-ranked finding is robust to input ordering. Use a regression test suite with permuted input orderings and verify that the top-ranked finding remains consistent across runs.
IMPLEMENTATION TABLE
Evaluation Rubric
Run these checks against a golden dataset of 10-20 known incident-pipeline pairs before shipping the CI/CD Pipeline Failure Correlation Prompt to production.
| Criterion | Pass Standard | Failure Signal | Test Method |
|---|---|---|---|
Temporal Window Accuracy | All correlated pipeline events fall within the specified [INCIDENT_WINDOW] or a justified pre-incident lookback period | Pipeline events outside the window are included without explicit justification in the output | Parse output timestamps; assert all timestamps are within [INCIDENT_WINDOW] ± [LOOKBACK_MARGIN] |
Artifact Change Completeness | Output lists all artifact changes (images, binaries, packages) deployed in the correlation window with commit SHAs or version identifiers | A known artifact change from the golden dataset is missing from the output without an explanation | Diff output artifact list against golden dataset expected artifact list; flag missing entries |
Test Regression Mapping | Each test regression is mapped to the specific pipeline stage and failing test suite or case name | A test regression is reported without a pipeline stage or test identifier, or a known regression is omitted | Check each regression entry for non-null stage and test_name fields; compare count against golden dataset |
Deployment Timing Precision | Deployment start and end timestamps are within 60 seconds of the golden dataset recorded times | Deployment timestamps deviate by more than 60 seconds or are reported as null for a known deployment | Parse deployment timestamps; compute absolute delta from golden dataset timestamps; assert delta ≤ 60s |
Ranking Consistency | The top-ranked pipeline event matches the golden dataset's labeled primary suspect in at least 85% of test cases | The primary suspect is ranked below position 1 or omitted entirely in more than 15% of test cases | Extract rank-1 event; compare to golden dataset primary_suspect label; compute match rate across test set |
Evidence Traceability | Every ranked pipeline event includes at least one concrete evidence pointer: a log line, metric, commit SHA, or alert ID | A ranked event appears with no evidence pointer or only a vague description like 'pipeline failed' | Scan each event entry for non-null evidence field; assert evidence is not empty string and contains a specific identifier |
Confounding Factor Flagging | Output explicitly flags when multiple pipeline changes overlap in time and cannot be disambiguated | Overlapping changes are reported as independent without a confounding note, or a single cause is asserted with low confidence | Search output for confounding_factor or ambiguity flag; verify presence when golden dataset has overlapping_change = true |
Output Schema Compliance | Output is valid JSON matching the [OUTPUT_SCHEMA] with all required fields present and no extra top-level keys | Output is missing a required field, contains an unexpected key, or is not parseable JSON | Validate output against JSON Schema; assert no missing required fields and no additional properties |
Enabling Efficiency, Speed & Accuracy
Intelligent Analysis, Decision & Execution
We build AI systems for teams that need search across company data, workflow automation across tools, or AI features inside products and internal software.
Talk to Us
Search across company data
Give teams answers from docs, tickets, runbooks, and product data with sources and permissions.
Useful when people spend too long searching or get different answers from different systems.
Enterprise searchRAGPermissions
Read more
Automate internal workflows
Use AI to route work, draft outputs, trigger actions, and keep approvals and logs in place.
Useful when repetitive work moves across multiple tools and teams.
AI agentsWorkflow automationGovernance
Read more
Add AI to products and internal tools
Build assistants, guided actions, or decision support into the software your team or customers already use.
Useful when AI needs to be part of the product, not a separate tool.
AI integrationDecision supportModel routing
Read moreADAPTATION OPTIONS
Adapt This Prompt
How to adapt
Use the base prompt with a single pipeline run log and a narrow incident window. Drop strict output schema requirements and accept a free-text correlation summary. Replace [OUTPUT_SCHEMA] with a simple instruction: "Return a bulleted list of pipeline events ordered by likelihood of relevance." Remove the confidence scoring requirement and the ranked output format.
Watch for
- The model may invent pipeline events not present in the input logs
- Timestamp correlation may be approximate without explicit timezone normalization
- No deduplication of repeated pipeline failures, leading to inflated event counts
- Missing distinction between cause and symptom in the correlation output

About the author
Prasad Kumkar
CEO & MD, Inference Systems
Prasad Kumkar is the CEO & MD of Inference Systems and writes about AI systems architecture, LLM infrastructure, model serving, evaluation, and production deployment. Over 5+ years, he has worked across computer vision models, L5 autonomous vehicle systems, and LLM research, with a focus on taking complex AI ideas into real-world engineering systems.
His work and writing cover AI systems, large language models, AI agents, multimodal systems, autonomous systems, inference optimization, RAG, evaluation, and production AI engineering.
LinkedIn
Limited slotsGet a Free AI Consultation
Partnered with leading AI, data, and software stack.





How We Work
Custom AI workflows for your Business
One-fit-all AI don't work for modern businesses. At Inferensys, we aim to understand your business & custom requirements; which we use to define most efficient agentic workflows, the data, and the tools for your business.
01
Review the use case
We understand the task, the users, and where AI can actually help.
Read more02
Pick the right approach
We define what needs search, automation, or product integration.
Read more03
Build the first useful version
We implement the part that proves the value first.
Read more04
Improve from there
We add the checks and visibility needed to keep it useful.
Read moreThe first call is a practical review of your use case and the right next step.
Talk to Us