
Inferensys

Integration

Data Governance and Quality AI for BI

Build AI monitors that connect to BI metadata and usage logs to automatically tag data, detect quality issues, enforce governance policies, and document data lineage for compliance.
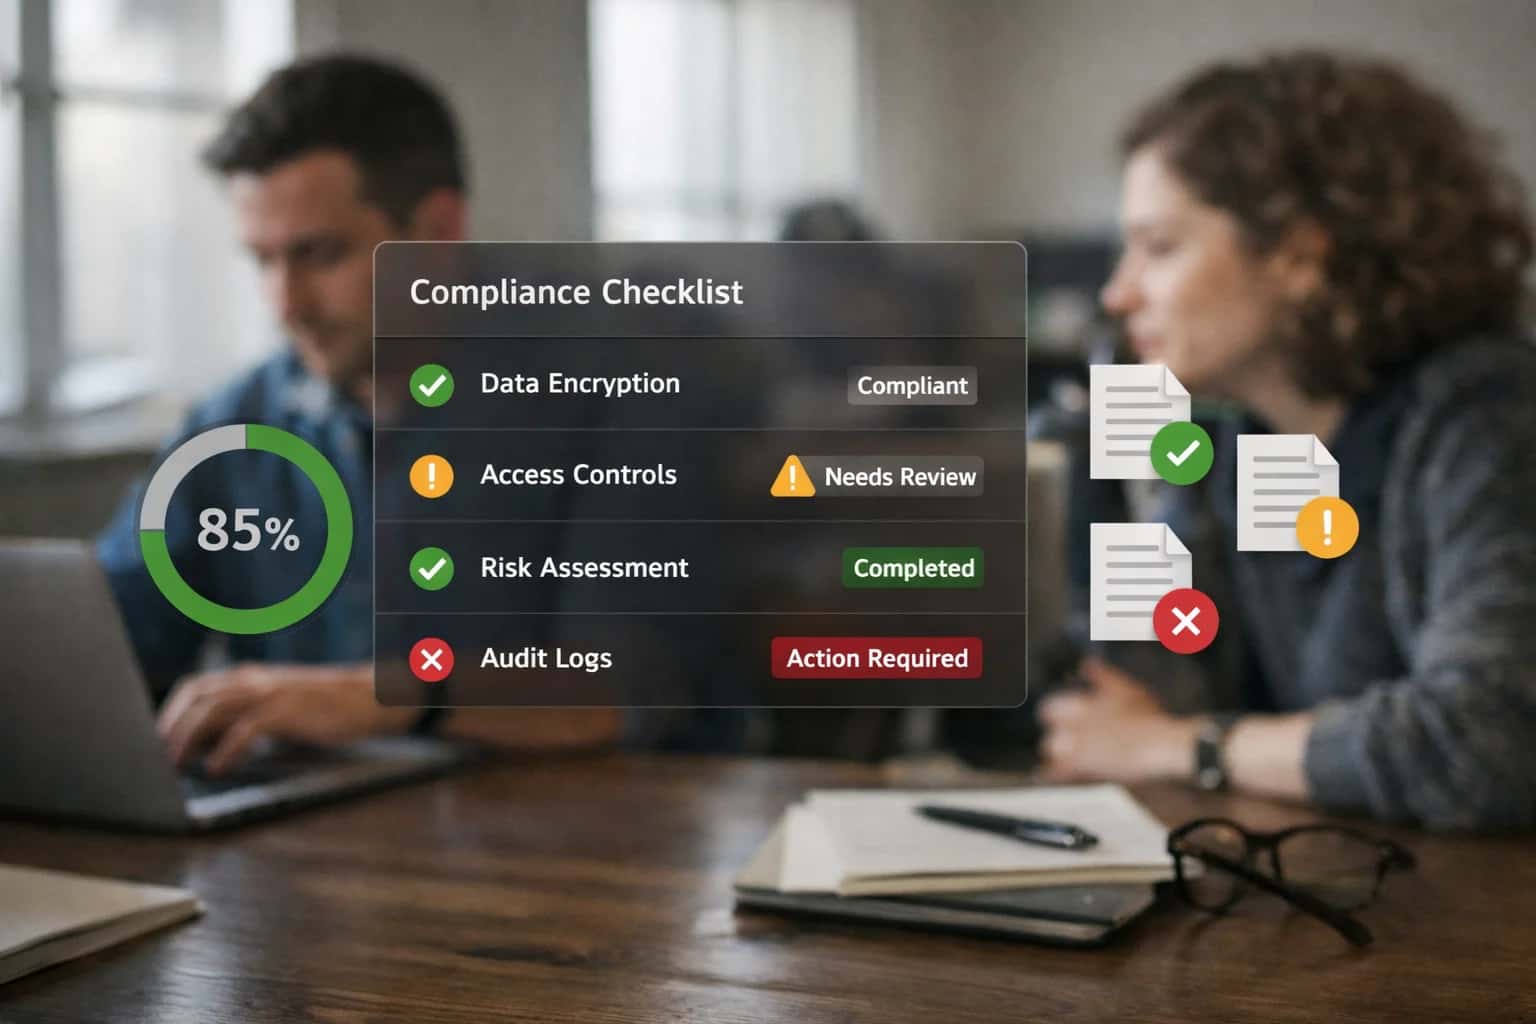
Security engineer reviewing FedRAMP compliance dashboard on ultrawide monitor, home office with city views, casual work session.
ARCHITECTURE & ROLLOUT

Where AI Fits into BI Data Governance

AI integration for BI data governance focuses on automating metadata management, quality monitoring, and policy enforcement across Tableau, Power BI, Looker, and Qlik.

AI agents connect directly to the metadata APIs and usage logs of platforms like Tableau Server, Power BI Service, Looker API, and Qlik Sense to monitor the health and compliance of your analytics estate. Key surfaces include:

  • Catalog Objects: Datasets, data sources, metrics, reports, and dashboards.
  • Lineage Graphs: Understanding dependencies between source systems, transformation jobs, and published dashboards.
  • User Activity Logs: Tracking report consumption, query patterns, and data export events.
  • Data Quality Metrics: Profiling column values, monitoring freshness, and detecting schema drift. The AI's role is to continuously audit this metadata layer, applying rules and learning from usage to automate governance tasks that are typically manual and reactive.


Implementation involves deploying lightweight monitoring agents that poll BI platform APIs on a schedule, streaming metadata changes to a central governance service. Core workflows include:

  • Automated Data Classification: Scanning column names and sample values to tag PII, financial data, or other sensitive categories, then applying row-level security (RLS) rules in Power BI or Tableau.
  • Anomaly Detection in Report Usage: Flagging unusual spikes in data exports or access from unauthorized locations, triggering alerts in ServiceNow or Slack.
  • Proactive Quality Alerts: When a critical dataset fails to refresh or exceeds defined quality thresholds, the AI can automatically notify the data steward via email and create a Jira ticket for remediation.
  • Lineage Impact Analysis: Before a source system migration, the AI can generate a report listing all downstream dashboards and calculated fields in Looker or Qlik that will be affected, preventing broken reports.

Rollout requires a phased approach, starting with a single BI platform and a high-value, low-risk use case like automated report certification. Governance is maintained by:

  • Human-in-the-Loop Approvals: All AI-suggested tags or policy changes should route through an approval workflow in your existing ServiceNow or Jira instance before being applied.
  • Audit Trails: Every action taken by the AI agent is logged with a timestamp, user context (service account), and rationale, feeding into your Splunk or Datadog monitoring.
  • Iterative Refinement: The system's classification and alerting rules are continuously tuned based on feedback from data stewards, avoiding alert fatigue. This creates a closed-loop system where AI handles the volume, and humans provide the strategic oversight.
ARCHITECTURE SURFACES

BI Platform Touchpoints for AI Governance

Connect AI to the Data Inventory

AI governance agents primarily interact with BI platform metadata APIs to understand what data exists, who uses it, and its quality. Key integration points include:

  • Tableau Metadata API: Query data sources, workbooks, and field-level lineage to auto-tag PII, classify business terms, and map usage.
  • Power BI Admin REST API: Scan datasets, reports, and semantic models to enforce naming conventions, detect deprecated assets, and log user access patterns.
  • Looker API (LookML): Parse the semantic model to validate metric definitions, check for broken dependencies, and document calculation logic for compliance.
  • Qlik Sense Engine API: Audit app and sheet objects to trace data associations and identify under-governed user-created content.

AI models use this metadata to auto-generate data catalogs, suggest stewardship assignments, and flag assets missing required documentation.

DATA QUALITY & COMPLIANCE

High-Value AI Governance Use Cases

Integrate AI directly with BI platform metadata, usage logs, and data pipelines to automate governance tasks, enforce quality policies, and maintain audit-ready lineage—turning static dashboards into intelligent, self-governing systems.

01

Automated Data Quality Monitoring

Deploy AI agents that continuously scan Tableau datasets, Power BI dataflows, and Looker explores for anomalies like null spikes, value drifts, or broken joins. Agents log issues, assign severity, and trigger alerts or automated remediation workflows in your data pipeline.

Batch -> Real-time
Issue detection
02

PII Detection & Classification

Use NLP models to scan BI metadata and sample data, automatically identifying and tagging columns containing personal, financial, or health information. Enforce access policies in Tableau Server or Power BI workspaces and generate compliance reports for audits.

1 sprint
Initial catalog coverage
03

AI-Powered Data Lineage Mapping

Connect to BI platform APIs (Tableau Metadata, Power BI Lineage) and ETL tools to infer and visualize data flow. AI agents document transformations, flag broken dependencies after schema changes, and predict dashboard impact before source data modifications.

Hours -> Minutes
Impact analysis
04

Usage-Based Governance & Cost Attribution

Analyze query logs and dashboard usage patterns in Looker, Power BI Premium, or Tableau Server to identify unused reports, expensive datasets, and shadow IT. Automatically recommend archiving, rightsizing, or re-architecting resources for FinOps.

Same day
Waste identification
05

Regulatory Report Generation & Validation

Build AI workflows that pull governed data from certified BI datasets, apply compliance logic (e.g., SOX, GDPR), generate narrative commentary, and produce audit-ready packages. Agents validate calculations against source systems and maintain a change log.

06

Semantic Layer & Business Glossary Management

Integrate with LookML, Power BI datasets, or Tableau Data Model to auto-suggest metric definitions, flag inconsistencies, and recommend standard calculations. Use AI to map user queries to approved business terms, reducing report fragmentation.

IMPLEMENTATION PATTERNS

Example AI Governance Workflows

These workflows illustrate how AI agents can be integrated with BI platform metadata, logs, and data pipelines to automate governance tasks, enforce quality policies, and maintain compliance. Each pattern connects to specific APIs and surfaces within platforms like Tableau, Power BI, Looker, and Qlik.

Trigger: Scheduled job runs after nightly data refresh or ETL completion.

Context Pulled:

  • BI platform metadata API call to fetch dataset/table names, row counts, and last refresh timestamps (e.g., GET /api/3.12/sites/{siteId}/datasources for Tableau, Power BI dataset refresh history).
  • Historical baseline metrics from a governance log database.

Agent Action:

  1. LLM-powered agent compares current metrics (row count, null percentage for key columns derived via a sample query) against baselines and defined thresholds.
  2. Agent uses statistical rules and a fine-tuned model to classify anomalies (e.g., "Volume drop >15%", "Key column null rate spike").
  3. For potential issues, the agent queries related metadata to assess impact: Which dashboards and reports depend on this dataset? (using Tableau's Workbook Datasource References or Power BI's lineage endpoints).

System Update:

  • Creates a ticket in Jira Service Management or ServiceNow via webhook with payload:
    json
    {
      "dataset": "sales_fact",
      "anomaly": "row_count_drop",
      "severity": "high",
      "impacted_reports": ["Executive Sales Dashboard", "Regional Performance"],
      "suggested_action": "Check upstream ERP feed job ETL_2024_04_15."
    }
  • Posts an alert to a dedicated Slack/Teams channel for the data engineering team.

Human Review Point: All generated tickets are routed to a "Data Quality" queue for analyst review and validation before corrective action is taken.

AI-POWERED DATA QUALITY AND GOVERNANCE

Implementation Architecture: Data Flow and Guardrails

A practical blueprint for integrating AI monitors with your BI platform's metadata and usage logs to automate governance, ensure quality, and maintain compliance.

The integration connects to your BI platform's administrative APIs and metadata layers—such as Tableau Server's REST API, Power BI's Admin APIs, Looker's API, or Qlik's QRS—to continuously ingest object metadata, data source definitions, user activity logs, and refresh histories. This forms the foundational data layer for AI analysis. A separate pipeline taps into the underlying data warehouse or lakehouse (e.g., Snowflake, BigQuery, Synapse) to sample actual data values for profiling and anomaly detection against defined quality rules.

Core AI agents operate on this unified metadata and data stream. A Data Quality Monitor uses statistical profiling and LLM-based pattern recognition to flag outliers, missing value trends, and schema drift, tagging assets in the BI catalog with confidence scores. A Governance Policy Engine parses natural language policies (e.g., "PII columns must be masked in sales dashboards") and scans the metadata graph to identify violations, automatically applying tags or triggering approval workflows. A Lineage Documenter traces column-level dependencies from source tables through transformations to final dashboards, generating plain-English summaries of data journeys for auditors.

Rollout is phased, starting with a single business domain (e.g., Finance) to refine detection logic and user notifications. Governance actions are initially recommendation-only, surfaced within the BI platform's native commenting or alert systems, requiring a data steward's approval. Over time, automated remediation workflows can be enabled—such as auto-archiving unused reports or applying sensitivity labels—governed by a human-in-the-loop approval queue. All AI actions are logged to a dedicated audit trail, linking the agent's reasoning (prompt, context, rule) to the asset and user affected for full transparency and compliance.

DATA GOVERNANCE AND QUALITY WORKFLOWS

Code and Payload Examples

Automating Data Catalog Enrichment

AI agents can connect to BI platform metadata APIs (e.g., Tableau Server REST API, Power BI Admin API) to scan new datasets, reports, and columns. Using a classification model, the system can automatically tag data with business glossary terms, identify PII/PHI, and generate plain-language descriptions.

Example Python workflow calling a classification service and updating the catalog:

python
import requests
# 1. Fetch unpublished workbook metadata from Tableau
workbook_metadata = get_tableau_workbook_metadata(workbook_id)
# 2. Send column names and sample data to LLM for classification
classification_payload = {
    "columns": workbook_metadata['columns'],
    "sample_values": workbook_metadata['sample']
}
tags = call_llm_classifier(classification_payload)
# 3. Apply tags back to Tableau via API
for col in tags['columns']:
    update_tableau_column_metadata(
        column_id=col['id'],
        description=col['generated_description'],
        tags=col['suggested_tags']
    )

This creates a searchable, governed catalog and reduces manual data stewardship work by 70-80%.

DATA GOVERNANCE AND QUALITY

Realistic Operational Impact and Time Savings

How AI monitors connected to BI metadata and usage logs transform manual, reactive data quality and governance tasks into automated, proactive operations.

Governance ActivityBefore AIAfter AIImplementation Notes

Data Quality Issue Detection

Manual report reviews or user complaints

Automated anomaly detection on key metrics

AI scans scheduled refresh logs and KPI trends to flag inconsistencies

PII and Sensitive Data Tagging

Manual column review and spreadsheet tracking

Automated classification using metadata and sample values

AI suggests tags for review; human approval loop for final confirmation

Impact Analysis for Schema Changes

Manual tracing and stakeholder emails

Automated lineage visualization and dashboard impact reports

AI maps table dependencies from BI metadata to generate change notices

Report Certification and Retirement

Quarterly manual audits and user surveys

Usage-based recommendations and automated deprecation workflows

AI analyzes query logs and user activity to identify stale or unused assets

Business Glossary and Metric Definition

Wiki pages updated sporadically by data stewards

AI-assisted definition drafting from SQL and dashboard context

AI proposes definitions; stewards refine and approve for consistency

Regulatory Compliance Evidence Gathering

Manual screenshot collection and narrative writing

Automated audit trail generation and report package assembly

AI compiles lineage, refresh logs, and access history for specific reports

Data Domain and Ownership Assignment

Spreadsheet maintenance and tribal knowledge

Usage pattern analysis to suggest logical domain groupings

AI analyzes query patterns and user groups to recommend ownership mappings

IMPLEMENTATION BLUEPRINT

Governance of the Governance AI: Phased Rollout

A practical guide to deploying AI for BI data governance with control, trust, and measurable impact.

A production rollout for Data Governance and Quality AI should follow a phased, risk-aware approach. Start by connecting your AI monitor to a single, high-value data domain—such as sales pipeline metrics in Tableau or financial close datasets in Power BI. Use the platform's metadata APIs (e.g., Tableau's REST API, Power BI's Dataset APIs) to ingest table schemas, column descriptions, and usage logs. In this initial phase, the AI's role is observation and suggestion: it should tag potential PII, detect broken data refreshes, and flag deprecated metrics, but all recommendations should flow into a human-reviewed queue in your existing ticketing system like Jira or ServiceNow.

The second phase introduces automated enforcement for low-risk policies. Once the AI's classification accuracy is validated (e.g., >95% precision in tagging data quality issues), you can configure it to auto-apply governance tags, close stale workbook alerts, and generate data lineage diagrams without manual approval. This requires tight integration with your BI platform's administrative functions and a secure, auditable service account. Implement a rollback mechanism and a dedicated audit log that records every AI-initiated action—what was changed, the confidence score, and the underlying data evidence—for compliance reviews.

The final, mature phase enables predictive and prescriptive governance. Here, the AI system uses historical patterns from your Looker usage logs or Qlik Sense app interactions to predict which new datasets will become critical, recommend optimal refresh schedules to balance cost and freshness, and proactively identify user groups requiring data literacy training. This phase often involves a bidirectional integration: the AI not only reads from the BI platform but also writes back enriched metadata, triggers data quality workflows in tools like Collibra or Alation, and can even initiate automated remediation scripts via webhooks.

Throughout all phases, maintain a human-in-the-loop for exceptions and a clear ownership model. Designate a BI Center of Excellence or Data Governance lead as the AI's business owner. Their role is to review the AI's performance dashboards (ironically, often built in the same BI platform), tune its detection thresholds, and adjudicate edge cases. This controlled, iterative approach ensures the "governance AI" itself is governed—building trust, demonstrating value, and scaling responsibly across your entire analytics estate.

DATA GOVERNANCE AND QUALITY

Frequently Asked Questions

Practical questions for teams implementing AI to automate data governance, quality monitoring, and lineage tracking within Business Intelligence platforms like Tableau, Power BI, Looker, and Qlik.

AI agents connect via the platform's REST APIs (e.g., Tableau Metadata API, Power BI Admin API, Looker API) to scan data source definitions, column names, and report objects.

Typical workflow:

  1. Trigger: A new dataset is published or a scheduled scan runs.
  2. Context Pulled: The agent fetches metadata for the new asset, including column names, data types, and sample values.
  3. AI Action: A classification model (LLM or fine-tuned model) analyzes the context to apply tags:
    • Business Glossary Terms: Matches column names to controlled vocabulary (e.g., revenue, customer_id).
    • Data Sensitivity: Identifies PII, PHI, or financial data using pattern recognition.
    • Data Quality Indicators: Flags columns that might need validation rules (e.g., percent columns outside 0-100).
  4. System Update: Tags are written back to the BI platform's metadata layer via API.
  5. Human Review Point: A governance steward receives a digest of new tags for high-sensitivity assets for final approval before enforcement.

This creates a searchable, policy-aware catalog directly within your BI tool.

Prasad Kumkar

About the author

Prasad Kumkar

CEO & MD, Inference Systems

Prasad Kumkar is the CEO & MD of Inference Systems and writes about AI systems architecture, LLM infrastructure, model serving, evaluation, and production deployment. Over 5+ years, he has worked across computer vision models, L5 autonomous vehicle systems, and LLM research, with a focus on taking complex AI ideas into real-world engineering systems.

His work and writing cover AI systems, large language models, AI agents, multimodal systems, autonomous systems, inference optimization, RAG, evaluation, and production AI engineering.


