The integration begins by connecting to the webhook and REST APIs of your retail execution platform—Repsly, Zipline, YOOBIC, or Movista—to stream raw audit results, task completions, photo evidence, and field notes into a secure processing pipeline. An AI orchestration layer applies computer vision for shelf images and NLP for open-text notes, transforming unstructured field data into structured, tagged insights such as compliance_score, root_cause, merchandising_anomaly, and predicted_risk. This enriched data is then pushed in near-real-time to a cloud data warehouse (e.g., Snowflake, BigQuery) that serves as the single source of truth for your BI platform.

Integration
AI Integration for Retail Execution and BI Tools
Connect AI-analyzed field data from Repsly, Zipline, YOOBIC, and Movista directly into Power BI, Tableau, or Looker. Create dynamic, natural-language dashboards that highlight compliance risks, execution gaps, and performance trends for regional managers and VPs of retail ops.
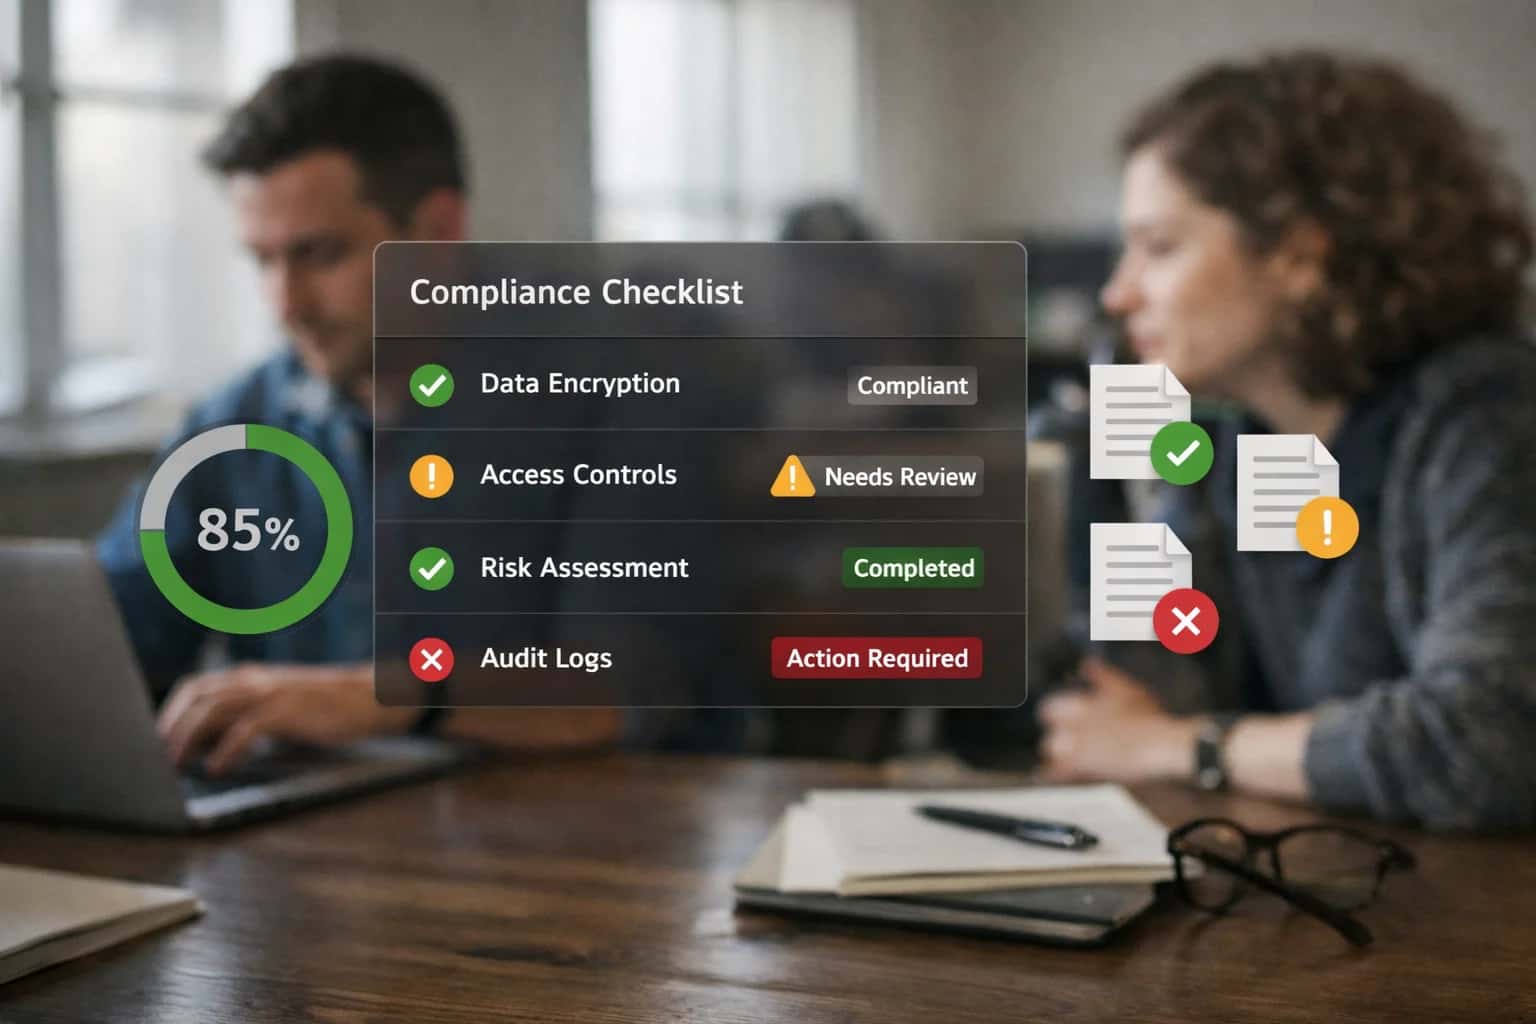
ARCHITECTURE AND ROLLOUT
From Raw Field Data to Actionable BI Dashboards
How to feed AI-generated insights from retail execution platforms into Power BI, Tableau, or Looker for dynamic, natural-language dashboards.
Within Power BI, Tableau, or Looker, you build dynamic dashboards that leverage these AI-generated fields. Instead of static charts, regional managers and VPs of retail ops can use natural language queries (e.g., "Show me stores with declining compliance in the Northwest region") to instantly surface AI-highlighted anomalies. Key workflows include: - Automated daily exception reports emailed to district managers, flagging stores where AI-detected issues require intervention. - Predictive trend lines that overlay execution KPIs with forecasted compliance risks, enabling proactive coaching. - Drill-down capabilities from a regional scorecard directly to the AI-analyzed audit images and notes within the native execution platform for context.
Rollout follows a phased approach: start with a single region and a high-impact use case like planogram compliance analytics to demonstrate value. Governance is critical; implement RBAC to control dashboard access and establish an audit trail for all AI-generated insights to ensure traceability back to the source field data. The final architecture creates a closed loop: field data enters the execution platform, AI enriches it, BI dashboards visualize it, and actionable insights are pushed back as prioritized tasks within the same platform—turning raw observations into operational intelligence in hours, not days.
ARCHITECTURE BLUEPRINT
Where AI Connects: Execution Platform APIs and BI Data Models
The Core Execution Data Layer
AI integrations start by pulling structured and unstructured data from the platform's core audit and task APIs. This includes:
- Completed Audit Records: Scores, checklists, timestamps, and location data from Repsly, YOOBIC, or Movista.
- Task Execution Logs: Status, completion notes, and photos from Zipline or Repsly task workflows.
- Unstructured Evidence: Free-text notes and image URLs from audit submissions.
This raw data is the primary input for AI models. A typical integration uses webhooks to listen for audit.completed or task.updated events, then processes the payload to extract key entities (store ID, auditor, score deviations) for analysis. The goal is to transform operational data into analyzable insights before pushing to BI models.
FROM EXECUTION DATA TO ACTIONABLE INSIGHTS
High-Value Use Cases for AI-Enhanced Retail BI
Transform raw field data from platforms like Repsly, Zipline, and YOOBIC into dynamic, natural-language dashboards in Power BI, Tableau, or Looker. These AI-powered workflows move retail operations from manual report-building to automated, insight-driven decision-making.
01
Automated Executive Scorecard Generation
AI agents ingest daily audit completion rates, compliance scores, and task statuses from retail execution platforms, synthesize trends, and push formatted summaries and visualizations directly into executive BI dashboards. This eliminates manual weekly report compilation for VPs of Retail Ops.
Weekly -> Daily
Reporting cadence
02
Anomaly Detection & Root Cause Analysis
Continuously monitor streams of store audit data for statistical outliers—like a sudden region-wide drop in merchandising scores. AI flags anomalies in real-time within the BI tool, correlates them with promotional calendars or staffing data, and suggests probable causes, enabling proactive intervention.
Reactive -> Proactive
Operational mode
03
Natural Language Q&A for Field Data
Embed a chat interface directly in the BI dashboard where regional managers can ask questions like, "Which stores in the Northwest have the lowest planogram compliance for Brand X this month?" The AI queries the connected retail execution platform data and returns a filtered list, chart, or map, democratizing data access.
Hours -> Seconds
Time to insight
04
Predictive Compliance Risk Scoring
Build a predictive model within the BI environment that uses historical audit data, seasonal trends, and manager tenure to generate a forward-looking risk score for each store. This score is visualized on a heatmap, allowing leaders to prioritize coaching visits and resources before audits occur.
1-2 Sprints
Implementation timeline
05
Dynamic KPI Driver Analysis
Go beyond static dashboards. AI analyzes correlations between execution KPIs (e.g., audit scores) and business outcomes (e.g., sales lift). It automatically surfaces the top drivers of performance in a given period within the BI report, answering "what moved the needle?" for leadership reviews.
06
Automated Insight-to-Action Workflows
When AI identifies a critical insight in the BI dashboard—like a cluster of stores failing safety audits—it can trigger an automated workflow back to the execution platform. This creates a corrective action task for the district manager in Zipline or Repsly, closing the loop from analytics to execution.
Batch -> Real-time
Action trigger
FROM RAW FIELD DATA TO ACTIONABLE INSIGHTS
Example AI-to-BI Workflows
These workflows demonstrate how AI-processed data from retail execution platforms (Repsly, Zipline, YOOBIC, Movista) can be transformed into dynamic, natural-language dashboards in Power BI, Tableau, or Looker for regional managers and VPs of retail operations.
Trigger: Daily batch of completed store audits from Repsly or YOOBIC.
Context Pulled: AI agent ingests audit scores, photo evidence, and open-text notes for the last 7 days.
Agent Action:
- Applies NLP to categorize notes (e.g., 'safety hazard', 'planogram misalignment', 'stockout').
- Uses computer vision to score image-based compliance (e.g., promotional material placement).
- Calculates a predictive risk score per store based on trends, severity, and recurrence of issues.
System Update:
- A pre-built Power BI dataset is updated with the new AI-generated fields:
risk_score,primary_issue_category,trend_direction. - A natural language summary is generated and stored as a KPI card: "West region shows a 15% increase in safety-related audit failures; Store #2042 is a top priority."
Human Review Point: The dashboard highlights stores exceeding a risk threshold. The regional manager clicks through from the BI dashboard to the specific audit in Repsly for detailed review.
CONNECTING EXECUTION DATA TO ANALYTICS
Implementation Architecture: Data Flow, APIs, and the AI Layer
A technical blueprint for feeding AI-generated insights from retail execution platforms into BI dashboards for operational leaders.
The integration architecture connects three layers: the retail execution platform (Repsly, Zipline, YOOBIC, Movista), an AI processing layer, and the BI/analytics platform (Power BI, Tableau, Looker). Data flow begins with the execution platform's REST APIs or webhooks pushing raw audit results, task completions, field notes, and image metadata to a secure ingestion endpoint. The AI layer, typically a cloud-based service, processes this stream—applying NLP to notes, computer vision to shelf images, and predictive models to compliance scores—to generate structured insights like root-cause analysis, risk scores, and trend summaries. These enriched insights are then written to a dedicated data store (e.g., a cloud data warehouse or the BI platform's native dataset) via its API, where they become available for dashboard visualization.
Key implementation details involve API orchestration and governance. For example, a POST to YOOBIC's webhook might trigger an AI agent to analyze a completed audit; the agent calls a vision model for photo analysis, an LLM for note summarization, and a rules engine to calculate a compliance risk score. The resulting JSON payload, containing the original audit ID and the new AI-generated fields, is then pushed to Power BI's REST API using a service principal for authentication. To manage scale and cost, implement a message queue (like Amazon SQS or Azure Service Bus) to handle spikes in data volume from field teams, ensuring insights are processed asynchronously and dashboards update within minutes, not hours.
Rollout and governance focus on data freshness and explainability. Start by connecting a single high-value data stream—such as planogram compliance audits—to a proof-of-concept dashboard for regional managers. Use the AI layer's audit trails to log all transformations, providing transparency for how an insight was generated. Implement role-based access in the BI tool to control who sees AI-generated scores versus raw data. Finally, establish a feedback loop where dashboard users can flag inaccurate insights, which are used to retune the AI models, creating a continuously improving system that turns field execution data into a strategic, actionable asset.
CONNECTING RETAIL EXECUTION DATA TO BI DASHBOARDS
Code and Payload Examples
Ingesting AI-Processed Audit Data
Configure a webhook in your retail execution platform (e.g., Repsly, YOOBIC) to send processed audit summaries to a secure endpoint. This payload contains AI-generated insights—like compliance risk scores and root-cause analysis—ready for dashboard consumption.
json{ "event_type": "audit.completed", "store_id": "STORE-78910", "audit_id": "AUD-2024-05-15-001", "timestamp": "2024-05-15T14:30:00Z", "ai_insights": { "overall_score": 92, "risk_category": "low", "primary_issue": "planogram_deviation", "summary": "Audit shows 95% planogram compliance. Two SKUs are out-of-stock. No safety violations detected.", "recommended_actions": ["Restock SKU A123", "Verify planogram for Section 7"] }, "metadata": { "region": "Northwest", "auditor_id": "REP-456", "platform": "repsly" } }
Your integration service listens for this payload, transforms it into a star schema, and pushes it to your data warehouse (e.g., Snowflake, BigQuery) for immediate availability in Power BI or Tableau.
FROM DATA TO DECISION
Realistic Time Savings and Business Impact
This table shows how integrating AI-generated insights from retail execution platforms into BI tools changes the workflow for regional managers and VPs of operations.
| Metric | Before AI | After AI | Notes |
|---|---|---|---|
Executive KPI Report Generation | Manual data pull, spreadsheet modeling, 4-6 hours per week | Automated synthesis and narrative, ready in 15 minutes | AI drafts insights; human reviews and contextualizes |
Root Cause Analysis for Compliance Drops | Ad-hoc querying across dashboards, manual correlation, next-day review | Automated anomaly detection with suggested drivers, same-day alerting | Focuses manager investigation on AI-highlighted regions or audit types |
Regional Performance Review Prep | Compiling slides from multiple dashboard exports, 1-2 days before meeting | Dynamic, natural-language summary per region generated on-demand | Enables real-time Q&A during reviews with live data querying |
Trend Identification Across Stores | Manual spot-checking, reliant on individual manager observation | Proactive alerts on emerging patterns (e.g., rising out-of-stocks in a district) | Shifts from reactive firefighting to proactive coaching |
Ad-hoc Data Exploration | IT ticket for new dashboard view, wait 3-5 business days | Natural language query in BI tool (e.g., "Show stores with declining merchandising scores") | Empowers ops leaders to self-serve without SQL or waiting |
Vendor Performance Reporting | Monthly manual scorecard compilation from audit data | Automated weekly vendor scorecard with compliance highlights and exceptions | Accelerates vendor review cycles and contract compliance discussions |
Rollout of New Playbook or Process | Post-rollout survey analysis weeks later to gauge adoption | Near-real-time analysis of audit data to measure adherence and identify coaching gaps | Enables agile adjustment of field guidance within the same business cycle |
ARCHITECTING FOR ENTERPRISE CONTROL
Governance, Security, and Phased Rollout
A practical guide to deploying AI for retail execution analytics with security, governance, and incremental value delivery in mind.
Integrating AI with platforms like Repsly, Zipline, or YOOBIC and BI tools like Power BI or Tableau requires a data-centric security model. This means implementing role-based access controls (RBAC) that mirror your existing platform permissions, ensuring a regional manager in Power BI only sees AI-generated insights for their territory. All data flows between the execution platform, AI processing layer, and BI tool should be encrypted in transit, with sensitive field data (e.g., employee notes, store images) optionally anonymized or pseudonymized before processing to protect PII. Audit logs must track the entire chain: which audit data was sent for analysis, the AI-generated insight, and which dashboard or user received it, creating a clear lineage for compliance reviews.
A phased rollout is critical for adoption and risk management. Start with a read-only pilot in a single region or for a single use case, such as automated sentiment analysis on store manager notes in YOOBIC, feeding a 'Field Morale' KPI into a pilot Tableau dashboard. This proves value without disrupting core workflows. Phase two introduces actionable insights with human review, like an AI that flags potential compliance breaches in Repsly audit photos but routes the alert and supporting evidence to a district manager for approval before any system is updated. The final phase enables closed-loop automation, where approved AI insights—like a predicted out-of-stock trend—can automatically generate a corrective task in Movista or update a forecast in a connected ERP system, all governed by pre-defined business rules.
Governance focuses on model accuracy and business alignment. Establish a review council with leaders from Retail Ops, IT, and Analytics to validate AI outputs against ground-truth field reports before scaling. Use the BI platform itself as a governance tool: build a 'Model Performance' dashboard that tracks key metrics like the precision of AI-flagged exceptions or user feedback on insight usefulness. This continuous feedback loop, powered by the same integrated data flow, ensures the AI remains aligned with operational reality. For a deeper technical dive on connecting these systems, see our guide on Retail Execution Platform APIs.
Enabling Efficiency, Speed & Accuracy
Intelligent Analysis, Decision & Execution
We build AI systems for teams that need search across company data, workflow automation across tools, or AI features inside products and internal software.
Talk to Us
Search across company data
Give teams answers from docs, tickets, runbooks, and product data with sources and permissions.
Useful when people spend too long searching or get different answers from different systems.
Enterprise searchRAGPermissions
Read more
Automate internal workflows
Use AI to route work, draft outputs, trigger actions, and keep approvals and logs in place.
Useful when repetitive work moves across multiple tools and teams.
AI agentsWorkflow automationGovernance
Read more
Add AI to products and internal tools
Build assistants, guided actions, or decision support into the software your team or customers already use.
Useful when AI needs to be part of the product, not a separate tool.
AI integrationDecision supportModel routing
Read moreIMPLEMENTATION AND INTEGRATION
Frequently Asked Questions
Common technical and operational questions for connecting AI-generated insights from retail execution platforms to BI dashboards for leadership.
The integration typically follows a secure, API-driven pattern:
- Trigger & Ingestion: An AI service processes raw audit data (images, notes, scores) from the retail execution platform via its REST API or webhooks. This service can be hosted in your cloud (AWS, Azure, GCP).
- AI Processing & Enrichment: The service runs models (e.g., for image analysis, sentiment scoring, anomaly detection) and appends structured insights (e.g.,
compliance_risk_score: 0.87,root_cause: "planogram_variance") to the original data payload. - Secure Output: The enriched data is written to a dedicated, secure storage layer. Common patterns include:
- Direct API Push: Writing to a dedicated table in your cloud data warehouse (Snowflake, BigQuery) that Power BI/Tableau connects to.
- File Export: Generating secure, signed URLs to JSON/CSV files in cloud storage (S3, Blob Storage) that the BI tool can ingest on a schedule.
- Governance: All data flows use service principals or OAuth with scoped permissions, never sharing user credentials. PII from field notes is redacted or tokenized before BI exposure.
This architecture keeps sensitive platform credentials within your controlled environment and feeds only the aggregated, insight-enriched data to the BI layer.

About the author
Prasad Kumkar
CEO & MD, Inference Systems
Prasad Kumkar is the CEO & MD of Inference Systems and writes about AI systems architecture, LLM infrastructure, model serving, evaluation, and production deployment. Over 5+ years, he has worked across computer vision models, L5 autonomous vehicle systems, and LLM research, with a focus on taking complex AI ideas into real-world engineering systems.
His work and writing cover AI systems, large language models, AI agents, multimodal systems, autonomous systems, inference optimization, RAG, evaluation, and production AI engineering.
LinkedIn
Limited slotsGet a Free AI Consultation
Partnered with leading AI, data, and software stack.





How We Work
Custom AI workflows for your Business
One-fit-all AI don't work for modern businesses. At Inferensys, we aim to understand your business & custom requirements; which we use to define most efficient agentic workflows, the data, and the tools for your business.
01
Review the use case
We understand the task, the users, and where AI can actually help.
Read more02
Pick the right approach
We define what needs search, automation, or product integration.
Read more03
Build the first useful version
We implement the part that proves the value first.
Read more04
Improve from there
We add the checks and visibility needed to keep it useful.
Read moreThe first call is a practical review of your use case and the right next step.
Talk to Us