The integration architecture centers on the Asana API and its Portfolios and Goals data model. A scheduled agent or webhook-driven service extracts key data points from multiple portfolios—including task completion rates, custom field values (like Budget Variance or Risk Score), timeline slippage, and Goal progress. This raw data is processed, enriched with historical context, and fed into a forecasting model. The outputs—predictive completion dates, capacity alerts, and aggregated health scores—are written back into dedicated Asana custom fields (e.g., AI Forecasted Completion, AI Confidence Score) or a dedicated Dashboard project, creating a live, machine-readable intelligence layer alongside human updates.
Integration
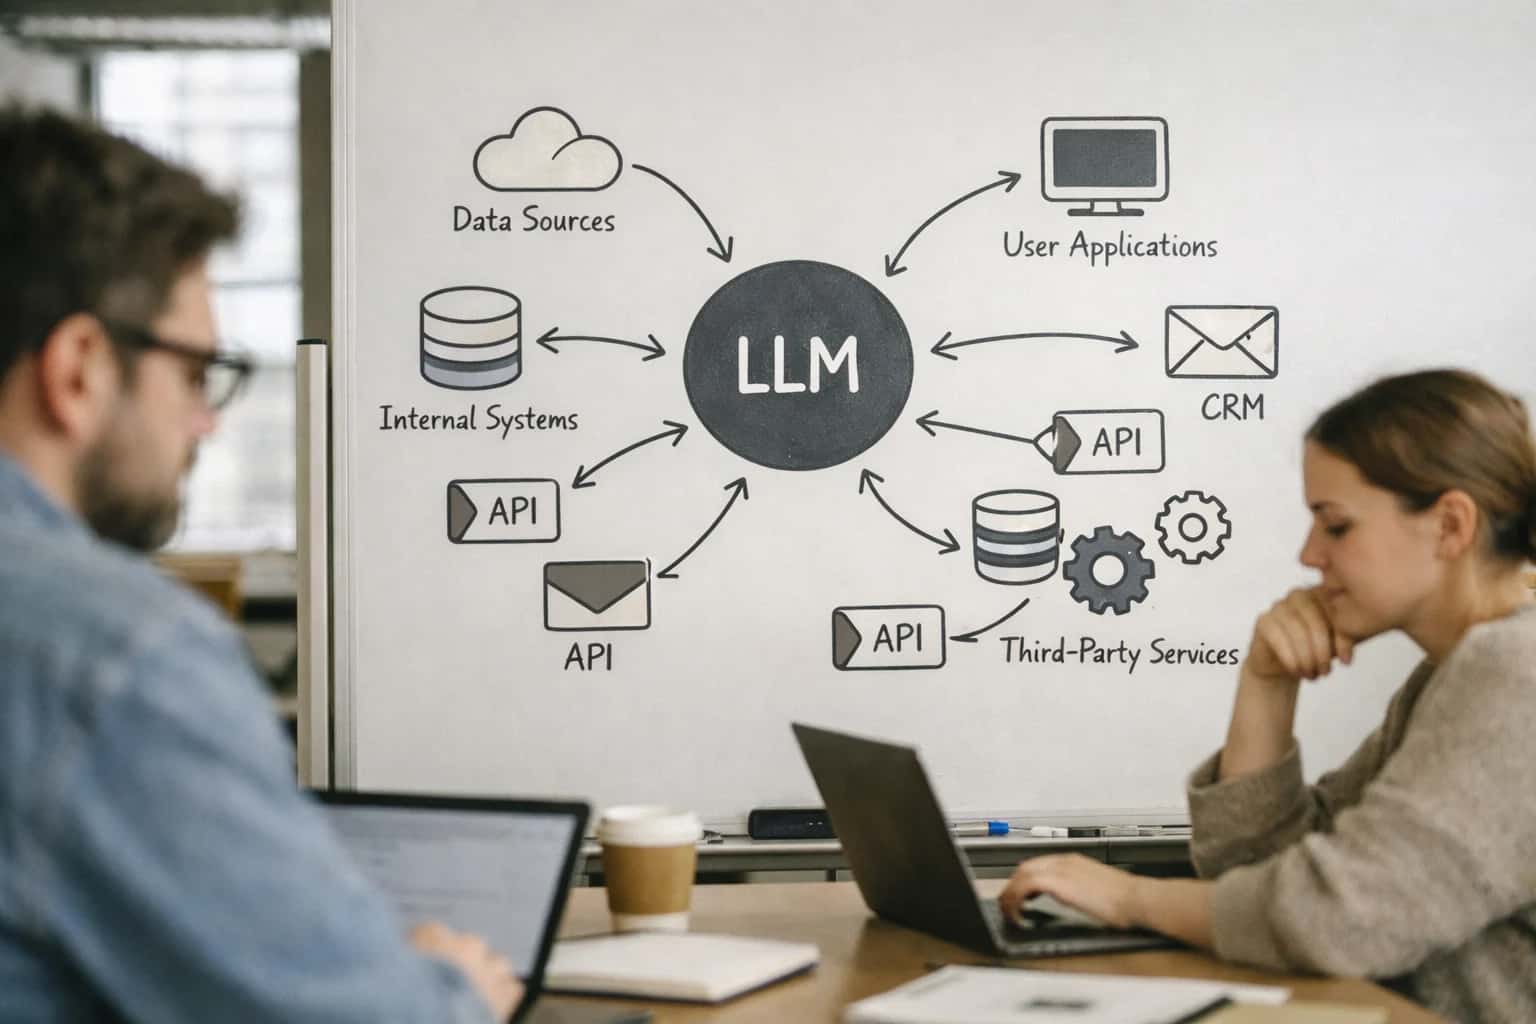
AI Integration for Asana Executive Dashboards
Architecture for AI-powered executive dashboards that pull data from multiple Asana portfolios, synthesize status, and provide predictive insights and natural language Q&A.
ARCHITECTURE AND ROLLOUT
From Static Dashboards to Interactive Intelligence Centers
A technical blueprint for transforming Asana Portfolios and Dashboards into AI-powered command centers that provide predictive insights and natural language Q&A.
For the interactive experience, we implement a RAG (Retrieval-Augmented Generation) layer that indexes portfolio summaries, recent status updates, and key decisions from task comments. This allows executives to ask natural language questions via a chat interface embedded in a custom dashboard or a dedicated Asana Message from an AI agent. Example queries include: “Which Q3 initiatives are most at risk due to resource constraints?” or “Summarize the blockers for the Product Launch portfolio.” The system retrieves relevant data, synthesizes an answer grounded in the latest Asana data, and can even suggest next actions, such as nudging a project owner for an update.
Rollout is phased, starting with a single portfolio as a proof-of-concept. Governance is critical: we establish a clear audit trail for all AI-generated insights and updates within Asana, tagging them with a source (e.g., AI Agent). A human-in-the-loop review step is configured for high-stakes forecasts or recommendations before they are shared broadly. The system is designed to augment, not replace, project manager judgment, turning static dashboards into interactive centers for strategic decision support.
ARCHITECTURE FOR EXECUTIVE DASHBOARDS
Key Asana Surfaces for AI Integration
The Strategic Data Layer
Asana Portfolios and Goals provide the structured, high-level data essential for executive dashboards. AI integration here focuses on synthesizing status and predicting outcomes.
Key Integration Points:
- Portfolio Health Fields: Use custom fields (e.g.,
Health Score,RAG Status) as write targets for AI models that analyze underlying project data. - Goal Progress: Connect to the Goals API to read current progress percentages and linked projects. AI can analyze project velocity to predict goal attainment likelihood and flag goals at risk.
- Portfolio Summaries: An AI agent can periodically query all projects within a portfolio, analyze custom fields, task completion rates, and recent comments to generate a narrative summary of overall status, key wins, and top blockers.
This surface turns static portfolio views into dynamic intelligence centers, answering questions like, "Which strategic initiatives are on track, and which need intervention?"
AI-POWERED DASHBOARDS
High-Value Executive Use Cases
Move beyond static charts. Embed AI directly into your Asana Portfolios and Goals to create executive dashboards that synthesize status, predict outcomes, and answer strategic questions in natural language.
01
Portfolio Health Synthesis
An AI agent continuously analyzes multiple Asana Portfolios, reading custom fields for budget, timeline variance, and risk scores. It generates a consolidated narrative summary, highlighting the top 3 projects at risk and overall portfolio confidence, posted daily to a dedicated executive dashboard task.
Batch -> Real-time
Reporting cadence
02
Predictive Goal Attainment
Connect AI to Asana Goals (OKRs) and their linked projects. The model forecasts the likelihood of achieving each goal based on the completion rate of supporting tasks, historical velocity, and dependency delays. Executives get a predictive confidence score and AI-generated recommendations for course correction.
1 sprint
Lead time on forecasts
03
Natural Language Q&A for Dashboards
Enable executives to ask questions like "Which Q3 initiatives are behind schedule due to resource constraints?" directly in a dashboard interface. An AI query engine uses the Asana API to fetch relevant portfolio, workload, and custom field data, returning a precise answer with supporting project links.
Hours -> Minutes
Time to insight
04
Automated Stakeholder Briefing
Replace manual slide creation. An AI workflow is triggered weekly, pulling data from specified portfolios. It tailors the output based on the stakeholder (e.g., deep dive for the CTO, financial summary for the CFO), generating a formatted brief with key metrics, progress visuals, and narrative highlights, then distributing it via email or Asana comment.
Same day
Brief generation
05
Risk Radar & Early Warning
An AI model monitors Asana tasks for signals of emerging risks—shifts in due dates, specific keywords in comments, new dependencies. It scores and aggregates these into a portfolio-level "Risk Radar," pushing proactive alerts to an executive dashboard and suggesting mitigation actions logged as follow-up tasks.
Real-time
Alerting
06
Capacity Forecasting & Investment Planning
Integrate AI with Asana's Workload view and custom resource fields. The system forecasts future team capacity bottlenecks across portfolios, simulating the impact of proposed new projects. This provides data-driven intelligence for executive decisions on hiring, outsourcing, or project prioritization.
Scenario-based
Planning support
ARCHITECTURE PATTERNS
Example AI Dashboard Workflows
These workflows illustrate how AI transforms static Asana executive dashboards into interactive intelligence centers. Each pattern connects to Asana's API, analyzes portfolio data, and delivers predictive insights or automated actions.
Trigger: Scheduled daily run or manual refresh from an executive dashboard widget.
Context Pulled: The AI agent queries the Asana API for:
- All projects within a specified Portfolio, fetching
name,due_date,current_status,custom_fields(e.g., RAG status, budget health). - Tasks flagged as
milestonesor with specific custom fields forblockers. - Recent status update text from the project's
notesfield.
Agent Action: A multi-step LLM call processes this data to:
- Calculate Health Scores: Synthesizes RAG statuses, due date proximity, and blocker counts into an overall portfolio health score (0-100).
- Generate Narrative Summary: Writes a 3-paragraph executive summary highlighting top risks, on-track projects, and recommended focus areas.
- Extract Actions: Identifies 3-5 critical next actions for leadership (e.g., "Escalate blocker for Project Alpha with Engineering VP").
System Update: The results are written back to Asana and surfaced in the dashboard:
- A summary is posted as a comment in the Portfolio's
notesfield with a timestamp. - Health score and top risk are written to dedicated Portfolio custom fields for dashboard filtering.
- Critical actions are created as tasks in a dedicated "Leadership Actions" project, tagged to the relevant owner.
Human Review Point: The narrative summary is presented in the dashboard with an "Approve for Distribution" button. Once approved, it's automatically emailed to a predefined stakeholder list.
BUILDING A PRODUCTION-READY DASHBOARD
Implementation Architecture: Data Flow & System Design
A practical blueprint for wiring AI into Asana's data model to power executive dashboards with synthesized insights and predictive analytics.
The core architecture connects to Asana's REST API, polling data from Portfolios, Goals, and Projects on a scheduled basis. Key data objects include:
- Tasks & Subtasks: For granular progress tracking.
- Custom Fields: Numeric fields for budget, confidence scores, and risk flags used as AI inputs.
- Sections & Columns: Status indicators (e.g., 'On Track', 'At Risk').
- Comments & Attachments: Unstructured data for sentiment and issue detection. This data is ingested, normalized, and stored in a time-series database alongside a vector store for semantic search across project descriptions and updates.
An orchestration layer (e.g., using n8n or a custom service) runs periodic jobs to:
- Synthesize Status: An LLM agent analyzes project timelines, completion percentages, and recent activity to generate a narrative summary for each portfolio.
- Predict Outcomes: A separate model uses historical velocity, dependency maps, and custom field trends to forecast milestone dates and flag projects likely to slip.
- Answer Natural Language Queries: A RAG pipeline grounds queries (e.g., 'Which Q3 initiatives are under-resourced?') in the latest project data, returning specific tasks, owners, and recommended actions. Results are written back to Asana via API—updating summary custom fields on portfolio items—and pushed to a dedicated dashboard UI (e.g., a Looker Studio or Retool application) that executives can access.
Rollout is phased, starting with a single portfolio to validate data quality and impact. Governance is critical: all AI-generated insights are tagged as such in the dashboard, with drill-downs to source Asana tasks for verification. A feedback loop allows executives to flag inaccurate summaries, which retrains the prompting strategy. The system is designed for asynchronous operation to avoid impacting Asana's performance, using webhooks for critical status changes and scheduled batches for comprehensive analysis.
ASANA API INTEGRATION PATTERNS
Code & Payload Examples
Aggregating Data for Executive Views
To build a predictive dashboard, you first need to reliably extract portfolio and project data from Asana. This involves querying multiple endpoints to gather tasks, custom fields, timelines, and goal progress. The key is to structure this data into a time-series format suitable for AI analysis.
A robust aggregation script should handle pagination, rate limits, and transform Asana's nested JSON into flat records. Store the results in a data warehouse or vector database to enable historical trend analysis and real-time Q&A. This foundational ETL process creates the single source of truth for all downstream AI features, from health scoring to natural language queries.
pythonimport asana # Initialize client with OAuth token client = asana.Client.access_token('YOUR_TOKEN') # Fetch portfolios for an executive portfolios = client.portfolios.get_portfolios(workspace='12345', opt_fields=['name', 'id']) portfolio_data = [] for portfolio in portfolios: # Get items (projects) in the portfolio items = client.portfolios.get_items_for_portfolio(portfolio['gid'], opt_fields=['name', 'due_on', 'current_status', 'custom_fields']) for item in items: # Enrich with detailed task summaries tasks = client.tasks.get_tasks_for_project(item['gid'], opt_fields=['completed', 'due_on', 'name'], limit=100) completed = sum(1 for t in tasks if t.get('completed')) portfolio_data.append({ 'portfolio_id': portfolio['gid'], 'project_id': item['gid'], 'project_name': item.get('name'), 'status': item.get('current_status', {}).get('text', 'No status'), 'due_date': item.get('due_on'), 'task_completion_rate': completed / len(tasks) if tasks else 0, 'timestamp': datetime.utcnow().isoformat() }) # Send to your analytics pipeline send_to_data_lake(portfolio_data)
AI-POWERED EXECUTIVE INSIGHTS
Realistic Time Savings & Operational Impact
This table illustrates the tangible operational improvements and time savings achieved by integrating AI into Asana executive dashboards, focusing on high-value workflows for portfolio and program leaders.
| Workflow | Before AI | After AI | Implementation Notes |
|---|---|---|---|
Portfolio Status Synthesis | Manual compilation from 5-10 portfolio dashboards (2-3 hours) | Automated daily briefing generated in minutes | AI aggregates data from Asana Portfolios, Goals, and custom fields via API |
Risk & Blocker Identification | Ad-hoc review in weekly meetings; issues often surface late | Proactive daily alerts on potential delays and resource conflicts | Monitors task dependencies, custom fields, and comment sentiment |
Forecast vs. Actual Analysis | Monthly spreadsheet reconciliation (4-6 hours) | Continuous tracking with anomaly alerts; summary on demand | AI analyzes timeline, budget, and progress columns across projects |
Natural Language Q&A on Portfolio Health | Schedule a meeting with a PMO analyst (next day) | Instant answers via chat interface in the dashboard | RAG system grounds queries in live Asana data via the API |
Stakeholder Report Generation | Manual slide deck creation for each review (1 day) | Automated, tailored narrative and data report (30 minutes) | Templates driven by role; AI drafts narrative from key metrics |
Capacity & Demand Forecasting | Quarterly planning cycle using static spreadsheets | Rolling 4-week forecast updated weekly with allocation recommendations | Integrates with Asana Workload and custom resource fields |
Initiative Health Scoring | Subjective scoring in steering committee | Objective, consistent scorecard based on 10+ data points | AI calculates score from timeline adherence, budget burn, and update quality |
ARCHITECTING FOR ENTERPRISE CONTROL
Governance, Security, and Phased Rollout
A practical blueprint for deploying AI-powered executive dashboards in Asana with appropriate controls, security, and a low-risk rollout strategy.
A production integration connects to the Asana API using a dedicated service account with scoped OAuth tokens, limiting access to specific Portfolios, Projects, and custom fields. AI-generated insights are written back to Asana as formatted comments in a dedicated Executive Summary task or as updates to a structured custom field (e.g., a 'Dashboard JSON' text field). This creates a clear audit trail within Asana's native activity log. All prompts, model calls, and data transformations are logged to a separate governance platform, linking each dashboard insight to the source Asana data and the generating prompt for full lineage.
Rollout follows a phased, value-driven approach:
- Phase 1 (Read-Only Pilot): An AI agent is configured to analyze a single, non-critical Portfolio. It generates a daily summary report posted as a comment, visible only to a pilot group. No automated actions are taken.
- Phase 2 (Interactive Q&A): With trust established, a natural language Q&A interface is added, allowing executives to ask questions like "Which projects are at risk this quarter?" The agent queries the Asana API, synthesizes an answer, and posts it, still within the pilot scope.
- Phase 3 (Predictive Insights & Broad Rollout): The system begins writing predictive fields (e.g., 'AI Forecasted Completion Date') and health scores to designated custom fields across all strategic Portfolios. Automated alerts for detected risks are configured, but routed to a human-in-the-loop approval step in Asana before creating follow-up tasks.
Security is enforced at multiple layers: data never leaves your cloud environment if using a private LLM; for hosted models, all Personally Identifiable Information (PII) and sensitive financials are redacted from Asana task names and descriptions before processing. The integration's access is reviewed quarterly against Asana's team and project permissions. This controlled, incremental path minimizes disruption while delivering tangible value, turning your Asana Portfolios into a governed intelligence layer. For related architectural patterns, see our guides on AI Integration for Asana API and AI Governance and LLMOps Platforms.
Enabling Efficiency, Speed & Accuracy
Intelligent Analysis, Decision & Execution
We build AI systems for teams that need search across company data, workflow automation across tools, or AI features inside products and internal software.
Talk to Us
Search across company data
Give teams answers from docs, tickets, runbooks, and product data with sources and permissions.
Useful when people spend too long searching or get different answers from different systems.
Enterprise searchRAGPermissions
Read more
Automate internal workflows
Use AI to route work, draft outputs, trigger actions, and keep approvals and logs in place.
Useful when repetitive work moves across multiple tools and teams.
AI agentsWorkflow automationGovernance
Read more
Add AI to products and internal tools
Build assistants, guided actions, or decision support into the software your team or customers already use.
Useful when AI needs to be part of the product, not a separate tool.
AI integrationDecision supportModel routing
Read moreIMPLEMENTATION AND OPERATIONS
Frequently Asked Questions
Practical questions for technical leaders and PMO directors planning to integrate AI with Asana for executive-level dashboards and reporting.
The integration is built on Asana's API and webhooks, acting as a centralized intelligence layer. Here’s the typical architecture:
- API Service Account: Create a dedicated service account in Asana with
adminormemberaccess to all relevant portfolios, projects, and workspaces. - Data Ingestion Pipeline: A scheduled job (e.g., hourly/daily) uses the Asana API to pull:
- Portfolio and project lists with custom fields (e.g.,
Health Score,RAG Status,Budget Variance %). - Task data for key milestones and deliverables.
- Goal progress from Asana Goals.
- Updates and comments from high-priority projects.
- Portfolio and project lists with custom fields (e.g.,
- Webhook Setup: Register webhooks for critical events (e.g., custom field changes, project status updates, milestone completion) to enable real-time dashboard refreshes.
- Context Aggregation: The AI system consolidates this data, linking projects to portfolios and goals, creating a unified context for analysis. This data is often stored in a vector database for semantic retrieval during Q&A sessions.
Security Note: The service account's permissions should follow the principle of least privilege, scoped only to necessary workspaces. All data is encrypted in transit and at rest.

About the author
Prasad Kumkar
CEO & MD, Inference Systems
Prasad Kumkar is the CEO & MD of Inference Systems and writes about AI systems architecture, LLM infrastructure, model serving, evaluation, and production deployment. Over 5+ years, he has worked across computer vision models, L5 autonomous vehicle systems, and LLM research, with a focus on taking complex AI ideas into real-world engineering systems.
His work and writing cover AI systems, large language models, AI agents, multimodal systems, autonomous systems, inference optimization, RAG, evaluation, and production AI engineering.
LinkedIn
Limited slotsGet a Free AI Consultation
Partnered with leading AI, data, and software stack.


How We Work
Custom AI workflows for your Business
One-fit-all AI don't work for modern businesses. At Inferensys, we aim to understand your business & custom requirements; which we use to define most efficient agentic workflows, the data, and the tools for your business.
01
Review the use case
We understand the task, the users, and where AI can actually help.
Read more02
Pick the right approach
We define what needs search, automation, or product integration.
Read more03
Build the first useful version
We implement the part that proves the value first.
Read more04
Improve from there
We add the checks and visibility needed to keep it useful.
Read moreThe first call is a practical review of your use case and the right next step.
Talk to Us