AI integration connects to the core data objects and surfaces of your BI platform—datasets, data models, metrics, and dashboard filters—to automate the heavy lifting of risk analysis. Instead of manually correlating data from GRC tools, ERP systems, internal audit findings, and external threat feeds, an AI agent can continuously scan these connected datasets. It calculates Key Risk Indicators (KRIs), flags deviations from control thresholds, and surfaces emerging exposures in supply chain, cybersecurity, financial compliance, or operational resilience before they escalate into incidents.
Integration
BI Platforms for Risk Management AI
Build AI-powered risk intelligence dashboards that aggregate data from multiple sources, calculate exposure, monitor controls, and generate compliance narratives in Tableau, Power BI, Looker, and Qlik.
FROM REACTIVE REPORTING TO PROACTIVE INTELLIGENCE
Where AI Fits into Risk Management Dashboards
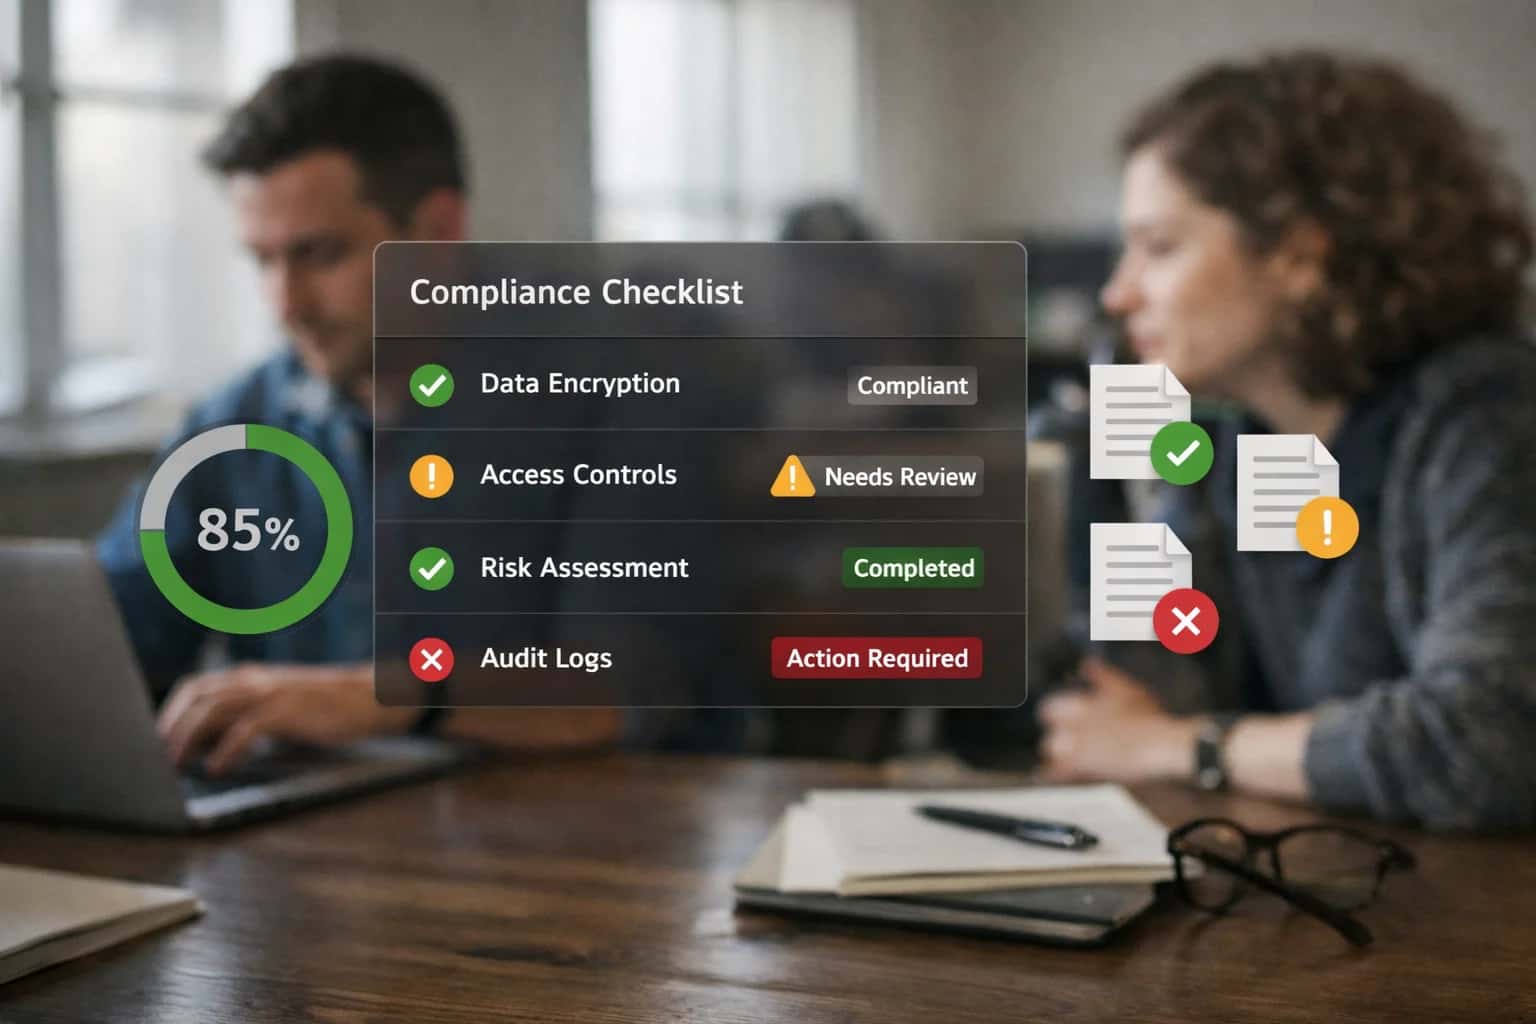
Integrating AI into platforms like Tableau, Power BI, and Looker transforms static risk dashboards into dynamic systems that calculate exposure, monitor controls, and generate compliance narratives.
Implementation typically involves an orchestration layer that sits between your data warehouse (e.g., Snowflake, BigQuery) and your BI platform's APIs (like the Tableau REST API or Power BI Service API). This layer runs scheduled or event-triggered AI workflows that: 1) Ingest refreshed dashboard data, 2) Apply risk-scoring models and anomaly detection, 3) Generate narrative explanations for risk posture changes, and 4) Update the dashboard with new visualizations, commentary cards, or alert statuses. For example, a dashboard tracking vendor risk could auto-generate a summary explaining a score drop due to recent news about a supplier's financial health, pulling from connected news APIs.
Rollout requires careful governance. AI-generated risk insights should be clearly labeled within the dashboard, with traceability back to source data and model logic. Implement a human-in-the-loop approval step for high-severity findings before they are published to executive dashboards. Use the BI platform's row-level security and audit logs to ensure risk data is accessed appropriately. Start with a single, high-impact risk domain—like IT security control effectiveness or third-party compliance status—to demonstrate value, then expand the AI's scope to other risk areas, using a common framework to maintain consistency across your risk intelligence program.
ARCHITECTING RISK INTELLIGENCE WORKFLOWS
AI Integration Points Across BI Platforms
Connecting Risk Data Sources
AI integration begins by connecting and enriching the raw data feeding your risk dashboards. This layer focuses on automating the consolidation of risk signals from disparate systems—ERP, CRM, supply chain logs, market feeds, and internal controls data—into a unified BI data model.
Key integration points:
- ETL/ELT Pipelines: Use AI agents to monitor and classify incoming data streams for quality issues, missing values, or schema drift that could impact risk calculations.
- Entity Resolution: Automatically link related records (e.g., a vendor across procurement, contract, and compliance systems) to build a complete risk profile.
- Data Enrichment: Call external APIs to append risk scores, geopolitical data, or financial health indicators to master records before they land in your BI platform's dataset.
This creates an AI-augmented, trusted foundation for all downstream risk analytics.
BI PLATFORM INTEGRATION PATTERNS
High-Value AI Use Cases for Risk Intelligence
Integrating AI with BI platforms like Tableau, Power BI, Looker, and Qlik transforms static risk dashboards into proactive intelligence systems. These patterns connect to platform APIs, data models, and alerting layers to automate analysis, generate narratives, and trigger actions.
01
Automated Control Monitoring & Narrative Generation
AI agents continuously scan dashboard metrics tied to key controls (e.g., SOX, SOC2). When thresholds are breached, they automatically generate a narrative explanation—correlating the breach with related system events or process changes—and post it as a comment on the dashboard or trigger a workflow in a GRC platform like ServiceNow.
Batch -> Continuous
Monitoring cadence
02
Multi-Source Exposure Aggregation & Heat Mapping
Build an AI layer that ingests and normalizes risk data from disparate sources (ERP, CRM, security tools) into a unified BI data model. An AI agent then calculates composite exposure scores, generates a dynamic risk heat map visualization in Power BI or Tableau, and flags emerging concentrations for review by the risk committee.
Days -> Hours
Report consolidation
03
Anomaly Detection for Emerging Risks
Deploy lightweight ML models via the BI platform's analytics extensions (e.g., Tableau's R/Python integration, Power BI's AI insights) to perform real-time anomaly detection on risk indicators. The system surfaces deviations in vendor performance, geo-political exposure, or operational metrics directly within the dashboard with a probable cause summary.
Reactive -> Proactive
Risk identification
04
Regulatory Change Impact Simulation
Connect an LLM agent to regulatory news feeds. When a new rule is published, the agent parses the text, maps requirements to existing controls in the BI data model, and runs a 'what-if' simulation in a tool like Looker or Qlik. It generates a report showing which dashboards, metrics, and processes are impacted and estimates remediation effort.
Weeks -> Same day
Impact analysis
05
Audit Evidence Pack Automation
For audit season, an AI workflow is triggered from the risk dashboard. It queries the BI platform's metadata and usage logs to automatically compile evidence packs: proving data lineage for key risk metrics, documenting user access to sensitive reports, and generating summaries of dashboard usage for control attestation. Output is formatted for audit platforms like Workiva.
Manual -> Automated
Evidence collection
06
Executive Risk Briefing Agent
An AI copilot, embedded via the BI platform's embedding APIs, provides a conversational interface to risk data. Executives can ask, 'What are our top three emerging risks in APAC?' The agent queries the underlying datasets, generates a concise summary with supporting visualizations, and cites the source dashboards. Integrates with tools like Microsoft Copilot for Power BI.
Hours -> Minutes
Briefing preparation
IMPLEMENTATION PATTERNS
Example Risk Management Workflows Powered by AI
These workflows illustrate how AI agents can be integrated with BI platforms like Tableau, Power BI, and Looker to automate risk intelligence, moving from static dashboards to dynamic, prescriptive risk management systems.
Trigger: A nightly ETL job loads updated vendor performance, financial, and compliance data into the data warehouse.
Context/Data Pulled: An AI agent queries the BI platform's semantic layer (e.g., Looker LookML, Power BI datasets) to pull:
- Vendor master data
- Recent delivery performance KPIs
- Financial stability scores from external feeds
- Open audit findings from the GRC system
- Geopolitical risk scores for vendor locations
Model or Agent Action: The agent runs a configured risk scoring model, weighting the latest data. It uses an LLM to generate a narrative summary for any vendor whose risk tier changes or where a critical threshold is breached (e.g., "Vendor X's financial score dropped 40%, and they have two high-priority audit findings overdue.").
System Update or Next Step: The agent:
- Updates a
vendor_risk_snapshottable in the warehouse with scores and narratives. - Posts a high-priority alert to a dedicated Microsoft Teams/Slack channel for the procurement team.
- Creates a task in the procurement team's project management tool (e.g., Asana) for follow-up.
Human Review Point: The risk narrative and score are presented in a Tableau dashboard with an "Acknowledge" button. A procurement manager must acknowledge the alert, which logs an audit trail and can trigger a deeper review workflow in the CLM system.
FROM DASHBOARDS TO DECISIONS
Implementation Architecture: Data Flow and AI Layer
A practical blueprint for integrating AI agents with BI platforms to automate risk intelligence, moving from static dashboards to dynamic, narrative-driven insights.
The core architecture connects your risk data sources—ERP, CRM, ITSM, external feeds—to a central data warehouse or lakehouse (e.g., Snowflake, BigQuery, Databricks). An orchestration layer (like Apache Airflow or Prefect) manages the ETL/ELT pipelines that feed cleansed, aggregated data into your BI platform's semantic layer (LookML, Power BI datasets, Tableau Data Sources). This is where the AI layer integrates: a set of purpose-built agents query this semantic model via the platform's REST APIs (Tableau Server API, Power BI REST API, Looker API) to perform scheduled or triggered analysis on key risk objects—exposure calculations, control effectiveness scores, incident trends, and compliance posture metrics.
For each risk domain (financial, operational, cyber, third-party), a dedicated AI agent executes. A Financial Risk Agent might analyze GL data to calculate Value-at-Risk (VaR) and generate commentary on concentration. An Operational Risk Agent scans incident logs to correlate events and predict control failures. These agents use a RAG (Retrieval-Augmented Generation) pipeline grounded in your internal policy documents, regulatory frameworks, and historical audit findings, ensuring outputs are context-aware and compliant. Results—calculated scores, narrative summaries, and recommended actions—are written back to the BI platform as custom metrics or commentary fields, or pushed to a dedicated 'AI Insights' dataset, which refreshes the risk dashboard. High-severity findings can trigger webhooks to create tickets in ServiceNow or assign tasks in Asana.
Rollout is phased, starting with a single risk domain (e.g., vendor risk) and a pilot dashboard. Governance is critical: all AI-generated insights are tagged with confidence scores and source references. A human-in-the-loop approval workflow is established for high-impact findings before they are published to executive dashboards. The system maintains a full audit log of agent queries, data accessed, and outputs generated, enabling traceability for internal audit and regulatory reviews. This architecture doesn't replace your BI platform or risk analysts; it augments them, turning dashboards from reporting tools into proactive risk intelligence systems that explain the 'why' behind every KPI movement.
RISK INTELLIGENCE WORKFLOWS
Code and Payload Examples
Automated Risk Exposure Scoring
This agent pulls aggregated data from a BI platform's semantic layer (e.g., Looker Explores, Power BI Datasets) to calculate a composite risk score across financial, operational, and compliance dimensions. It uses a configurable scoring model and writes the results back to a risk register table for dashboard consumption.
python# Example: Agent that calculates and logs exposure scores def calculate_risk_exposure(risk_entity_id: str, bi_connection): """Fetch aggregated metrics and compute exposure.""" # Query the BI semantic layer for pre-aggregated metrics query = f""" SELECT SUM(financial_exposure) as fin_exp, AVG(control_effectiveness_score) as control_score, COUNT(open_issues) as issue_count FROM risk_metrics_explore WHERE risk_entity_id = '{risk_entity_id}' AND period = 'CURRENT_QUARTER' """ metrics = bi_connection.execute_query(query) # Apply weighted scoring model (configurable via vector store) exposure_score = ( (metrics['fin_exp'] * 0.5) + ((100 - metrics['control_score']) * 0.3) + (metrics['issue_count'] * 0.2) ) # Log to risk register payload = { "risk_entity_id": risk_entity_id, "calculated_score": round(exposure_score, 2), "calculation_timestamp": datetime.utcnow().isoformat(), "metric_snapshot": metrics } return payload
The agent can be scheduled or triggered by data refresh events, ensuring dashboards always reflect the latest calculated exposure.
BI PLATFORMS FOR RISK MANAGEMENT AI
Realistic Time Savings and Operational Impact
How AI integration transforms risk monitoring, exposure analysis, and compliance reporting workflows within Tableau, Power BI, Looker, and Qlik dashboards.
| Risk Management Workflow | Before AI Integration | After AI Integration | Implementation Notes |
|---|---|---|---|
Control Monitoring & Exception Reporting | Manual weekly review of dashboards; 8-12 hours per analyst | Automated daily anomaly detection with prioritized alerts; 2-3 hours review | AI scans KPIs against thresholds, flags deviations, and suggests root causes |
Multi-Source Exposure Aggregation | Manual data consolidation from ERPs, spreadsheets, and external feeds; 1-2 days per cycle | Automated ingestion and harmonization; exposure dashboards refresh in near real-time | AI agents map and reconcile entity data across sources, maintaining a single risk view |
Compliance & Audit Narrative Generation | Manual drafting of control summaries and audit evidence; 3-5 days per quarter | AI-assisted narrative generation from dashboard metrics; draft in 1 day, human review | LLMs synthesize KPI trends and control states into structured narratives for regulators |
Risk Heat Map Maintenance | Quarterly manual updates based on stakeholder workshops; 40-60 person-hours | Semi-automated updates with AI-suggested scoring based on incident and market data | AI proposes risk score adjustments; human experts validate and override |
Incident Triage & Impact Analysis | Manual correlation of incidents to assets and processes; 4-6 hours per major event | AI-assisted correlation and preliminary impact assessment; initial report in <1 hour | AI links incidents to registered assets, calculates probable financial/operational impact |
Regulatory Change Monitoring | Manual tracking of regulatory updates and gap analysis; 10-15 hours monthly | AI scans regulatory feeds, maps changes to existing controls, flags gaps; 2-3 hours review | Requires initial taxonomy mapping; AI suggests control modifications for new regulations |
Board & Executive Risk Reporting | Manual slide deck creation from multiple dashboards; 5-7 days per report | Automated report generation with AI commentary on key risk trends; draft in 1 day | AI pulls data from approved risk dashboards, generates narrative, highlights trends |
ARCHITECTING FOR COMPLIANCE AND CONTROL
Governance, Security, and Phased Rollout
Deploying AI for risk management requires a security-first architecture and a controlled rollout to ensure trust and compliance.
A production risk intelligence dashboard integrates with multiple sensitive data sources—ERP financials, CRM exposures, third-party vendor feeds, and internal control systems. The architecture must enforce strict role-based access control (RBAC) at the BI layer (e.g., Tableau permissions, Power BI workspaces) and ensure AI agents only query data scoped to the user's entitlements. All AI-generated insights, such as exposure calculations or control gap narratives, should be logged with a full audit trail linking back to the source records and the specific LLM prompts used.
Implementation typically uses a middleware layer (like an API gateway or a dedicated orchestration service) between the BI platform and the AI models. This layer handles authentication, data masking for PII/PHI before sending to the LLM, prompt governance, and response validation. For instance, a "Control Effectiveness Score" generated by AI for a dashboard would be calculated by the middleware agent pulling data from the GRC system, applying a governed prompt template, and writing the result—along with the supporting evidence—back to a dedicated audit table before the dashboard refreshes.
Rollout should be phased, starting with read-only, human-in-the-loop workflows. Phase 1 might deploy AI to generate draft compliance narratives for quarterly risk reports within Power BI, requiring analyst review and approval before publication. Phase 2 could introduce automated monitoring of key risk indicators (KRIs) in a Tableau dashboard, where AI flags anomalies and suggests potential drivers, but any corrective action workflow is manually initiated. Phase 3, after validation and trust-building, enables prescriptive agents that can automatically create Jira tickets for control remediation or adjust risk ratings in the source system, all within a defined policy envelope.
Continuous governance is critical. Establish a cross-functional review board (Risk, IT, Legal) to approve new AI use cases, review the accuracy and bias of outputs against held-out data, and update prompt libraries as regulations change. Tools like Weights & Biases or Arize AI can be integrated to track model performance and drift in production. This controlled, iterative approach ensures the AI integration enhances risk management without introducing ungoverned automation or compliance gaps.
Enabling Efficiency, Speed & Accuracy
Intelligent Analysis, Decision & Execution
We build AI systems for teams that need search across company data, workflow automation across tools, or AI features inside products and internal software.
Talk to Us
Search across company data
Give teams answers from docs, tickets, runbooks, and product data with sources and permissions.
Useful when people spend too long searching or get different answers from different systems.
Enterprise searchRAGPermissions
Read more
Automate internal workflows
Use AI to route work, draft outputs, trigger actions, and keep approvals and logs in place.
Useful when repetitive work moves across multiple tools and teams.
AI agentsWorkflow automationGovernance
Read more
Add AI to products and internal tools
Build assistants, guided actions, or decision support into the software your team or customers already use.
Useful when AI needs to be part of the product, not a separate tool.
AI integrationDecision supportModel routing
Read moreIMPLEMENTATION AND ARCHITECTURE
Frequently Asked Questions
Practical questions for teams building AI-powered risk intelligence dashboards on platforms like Tableau, Power BI, Looker, and Qlik.
The typical architecture involves a middleware layer that orchestrates data flow and model inference. Here’s a common pattern:
- Trigger: A scheduled refresh in the BI platform (e.g., Power BI dataset refresh, Tableau extract update) or a user action in a dashboard triggers a call.
- Data Context: Your middleware service calls the BI platform's API (Power BI REST API, Tableau Server Client Library) to pull the latest aggregated risk data—exposure amounts, control statuses, incident counts—for the relevant entities (vendors, projects, regions).
- Model Action: This data payload is sent to your risk-scoring AI model. This could be a hosted LLM API (for narrative generation) or a custom ML model (for calculating a quantitative risk score).
- System Update: The resulting scores and narratives are written back to a dedicated table in your data warehouse (e.g., Snowflake, BigQuery) or a secondary dataset in the BI platform.
- Dashboard Consumption: The BI dashboard is configured to join this new risk score table with the core data, enabling visual highlights, sorting, and alerting based on the AI-generated scores.
Key Consideration: For real-time needs, use the BI platform's real-time connectivity (like Power BI DirectQuery, Looker's persistent derived tables) to point directly to the updated scores in your warehouse, avoiding full dataset refreshes.

About the author
Prasad Kumkar
CEO & MD, Inference Systems
Prasad Kumkar is the CEO & MD of Inference Systems and writes about AI systems architecture, LLM infrastructure, model serving, evaluation, and production deployment. Over 5+ years, he has worked across computer vision models, L5 autonomous vehicle systems, and LLM research, with a focus on taking complex AI ideas into real-world engineering systems.
His work and writing cover AI systems, large language models, AI agents, multimodal systems, autonomous systems, inference optimization, RAG, evaluation, and production AI engineering.
LinkedIn
Limited slotsGet a Free AI Consultation
Partnered with leading AI, data, and software stack.


How We Work
Custom AI workflows for your Business
One-fit-all AI don't work for modern businesses. At Inferensys, we aim to understand your business & custom requirements; which we use to define most efficient agentic workflows, the data, and the tools for your business.
01
Review the use case
We understand the task, the users, and where AI can actually help.
Read more02
Pick the right approach
We define what needs search, automation, or product integration.
Read more03
Build the first useful version
We implement the part that proves the value first.
Read more04
Improve from there
We add the checks and visibility needed to keep it useful.
Read moreThe first call is a practical review of your use case and the right next step.
Talk to Us