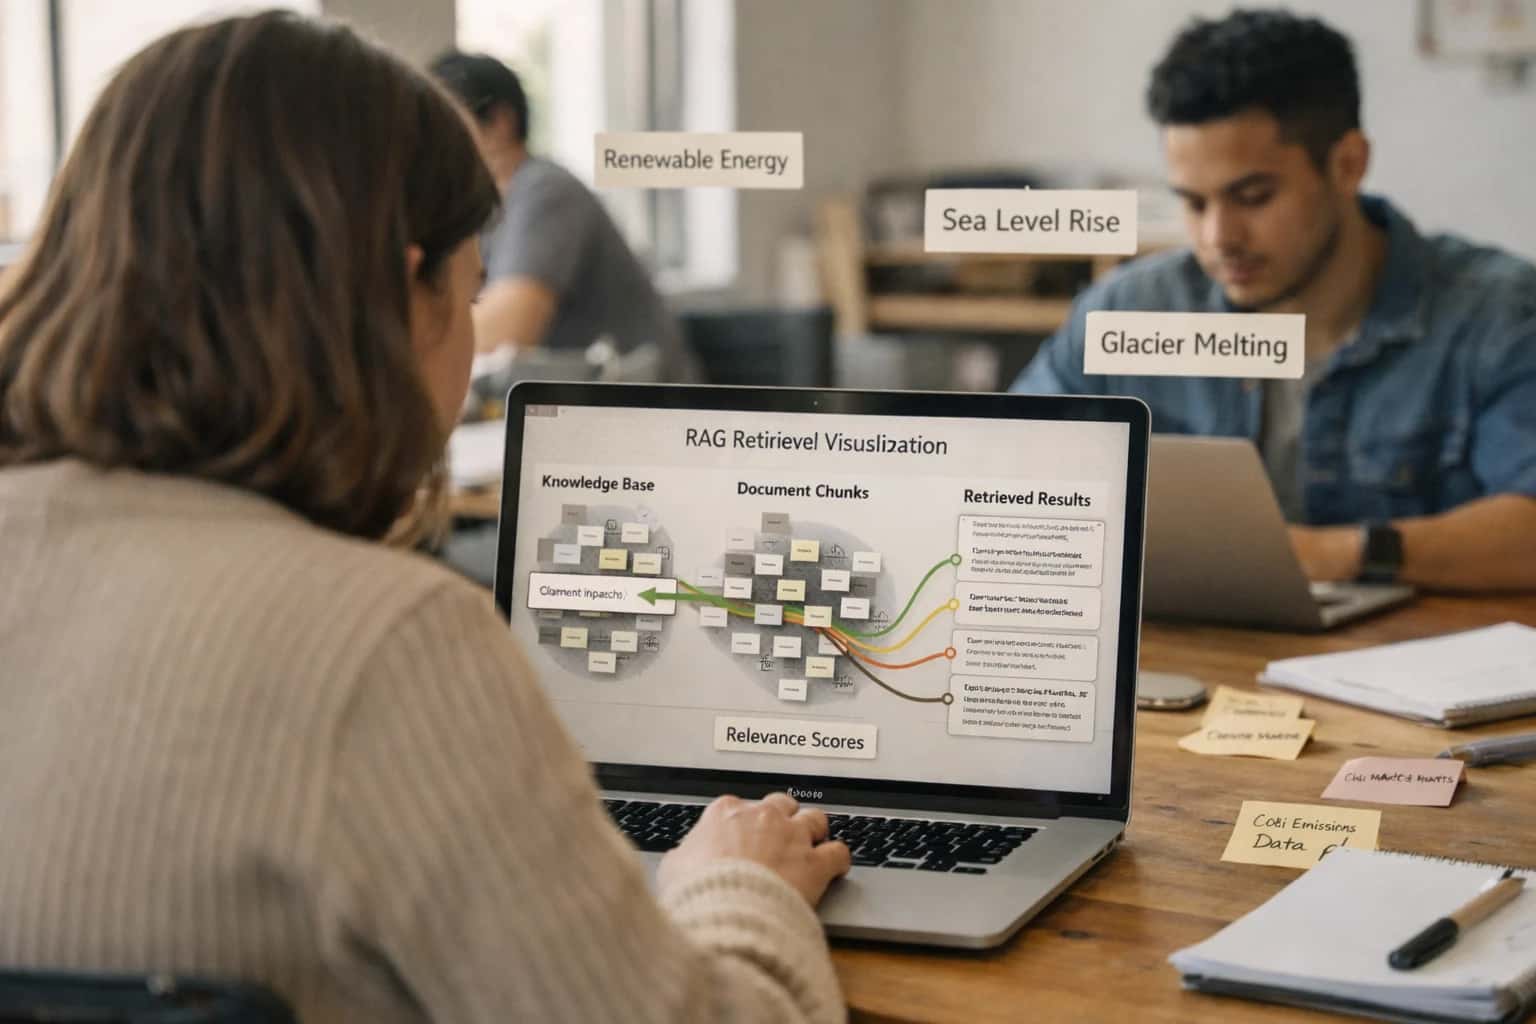
In a production LangChain RAG system, observability must be woven into three critical layers: the retrieval layer (vector store queries, chunk relevance, embedding drift), the generation layer (LLM API calls, token usage, latency, structured output parsing), and the orchestration layer (chain execution, tool calls, error handling). Without integrated tracing, you're flying blind on whether poor answers stem from bad retrieval, a weak prompt, or a degraded LLM endpoint. Platforms like Weights & Biases or Arize AI connect to these layers via LangChain's callback system or direct SDK integration, logging each step—from document chunk retrieval to final answer validation—into a unified timeline.
Integration
AI Integration for LangChain RAG Pipelines
Production-ready instrumentation for LangChain RAG systems. Implement end-to-end observability, track retrieval accuracy, and optimize knowledge base strategies with integrated monitoring and governance.
ARCHITECTURE BLUEPRINT
Where Observability Fits in Your LangChain RAG Stack
A practical guide to instrumenting your Retrieval-Augmented Generation pipeline for production reliability, cost control, and continuous improvement.
For rollout, start by instrumenting a single high-value workflow, such as a customer support knowledge agent. Implement tracing to capture: the user's raw query, the top-k retrieved document chunks and their similarity scores, the final prompt sent to the LLM, the raw completion, any post-processing (like output parsing), and the end-user feedback score. This creates a 'golden thread' for debugging. You can then set up automated evaluations in LangSmith or Arize AI using LLM-as-a-judge to score answer relevance against the retrieved context, alerting your team when hallucination rates spike or retrieval recall drops below a threshold.
Governance requires treating the RAG pipeline as a versioned asset. The prompt template, chunking strategy, embedding model, and index are all configuration that can drift. Use a model registry like W&Bs Model Registry to version these components together. Implement canary deployments for prompt or index changes, routing a small percentage of traffic to the new configuration while monitoring for regressions in key metrics. Finally, integrate with a policy engine like Credo AI to enforce guardrails—such as blocking outputs that contain PII or ensuring citations are provided for certain topics—before responses reach the end-user. This layered observability transforms your RAG stack from a prototype into a reliable, governed service.
FOR END-TO-END OBSERVABILITY
Key LangChain Components to Instrument
The Foundation of RAG Performance
Instrumenting the retrieval layer is critical for diagnosing poor answer quality. This involves monitoring the vector store (e.g., Pinecone, Weaviate) and the text splitters that create document chunks.
Key metrics to track:
- Chunk Relevance Score: The cosine similarity between the user query embedding and the top-k retrieved chunks. A low score indicates poor semantic search.
- Retrieval Latency: Time to fetch chunks from the vector database, which impacts user experience.
- Embedding Drift: Monitor for shifts in the distribution of your document embeddings over time, which can degrade retrieval accuracy. Use tools like Arize AI to set statistical alerts.
- Index Freshness: Track the last update timestamp for your knowledge base index to ensure information is current.
Instrumentation here answers: Was the right information retrieved to answer the question?
LANGCHAIN RAG PIPELINES
High-Value Observability Use Cases
For production LangChain RAG systems, observability is not a luxury—it's a requirement for reliability, cost control, and continuous improvement. These cards outline key integration patterns to instrument, monitor, and govern your retrieval and generation workflows.
01
Retrieval Accuracy & Chunk Relevance
Track which retrieved documents led to correct or incorrect answers. Monitor chunk relevance scores, top-k selection, and embedding similarity drift to optimize your indexing strategy and chunking logic. Integrate with vector store logs to correlate retrieval performance with business outcomes.
Batch -> Real-time
Insight cadence
02
End-to-End Pipeline Tracing
Trace a single user query from input through retrieval, prompt assembly, LLM call, and final output. Capture latency, token usage, and costs at each step (embedding, vector search, generation). Use this data to identify bottlenecks, debug failures, and attribute expenses to specific workflows or teams.
1 sprint
Debugging time saved
03
LLM-as-a-Judge for Answer Quality
Automate the evaluation of generated answers by using a separate LLM judge with custom rubrics (factuality, completeness, helpfulness). Integrate these scores into your monitoring dashboard to track quality trends, set alerts for degradation, and trigger human review for low-confidence outputs.
Hours -> Minutes
Evaluation cycle
04
Hallucination & Groundedness Detection
Monitor for unsupported statements by comparing LLM outputs against retrieved source documents. Implement checks for citation accuracy and extractive content overlap. Flag high-hallucination-rate queries for prompt engineering or knowledge base expansion, reducing operational risk.
Same day
Risk identification
05
Cost Attribution & Token Efficiency
Break down LLM API costs by application, user, or department. Monitor token usage per query across embedding models and chat/completion models. Identify inefficient prompts or retrieval patterns driving unnecessary spend, enabling FinOps for AI workloads.
Batch -> Real-time
Spend visibility
06
Data Drift for Knowledge Base & Queries
Detect shifts in the distribution of user queries and ingested document content. Alert when new query types emerge or source material changes significantly, signaling the need to re-index or update prompts. Prevent silent performance decay in your RAG application.
Proactive
Decay prevention
PRODUCTION PATTERNS
Example Instrumented RAG Workflows
These are real-world workflows for LangChain RAG pipelines, instrumented end-to-end with tracing, evaluation, and governance platforms. Each pattern includes the trigger, data flow, model actions, system updates, and integrated observability points.
Trigger: A new ticket is created in Zendesk or ServiceNow via webhook.
Context/Data Pulled:
- Ticket title, description, and customer history are extracted.
- A LangChain retriever queries a vector store (Pinecone/Weaviate) indexed with knowledge base articles, past resolved tickets, and product documentation.
- The top 5 relevant chunks are fetched with metadata (source URL, recency score).
Model/Agent Action:
- A LangChain chain uses the retrieved context and ticket data to:
- Classify urgency and likely product area.
- Summarize the core issue.
- Suggest 1-3 potential solutions or escalation paths.
- This structured output is generated using a Pydantic model for validation.
System Update/Next Step:
- The classification, summary, and suggestions are written back to the ticket as internal notes.
- The ticket is automatically tagged and routed to the appropriate queue.
- A low-confidence score from the chain triggers a flag for human agent review.
Integrated Observability:
- LangSmith Tracing: The entire chain run—including retrieval latency, token usage, and the exact prompts—is logged with a unique
run_id. - Arize AI Monitoring: Embedding drift for the retrieved chunks and the final answer's relevance score (via LLM-as-judge) are tracked. A spike in low-confidence outputs triggers an alert.
- Credo AI Logging: The action (automated triage) and the data accessed (KB, past tickets) are logged for the audit trail to demonstrate adherence to support protocols.
INSTRUMENTING LANGCHAIN FOR PRODUCTION OBSERVABILITY
Implementation Architecture: Data Flow and Telemetry Collection
A practical blueprint for wiring LangChain RAG pipelines to governance and LLMOps platforms for end-to-end traceability.
A governed LangChain RAG pipeline requires instrumentation at three key layers: the retrieval layer, the generation layer, and the orchestration layer. For retrieval, you must log metadata for each query—such as the retrieved document IDs, chunk relevance scores, and the embedding model used—to systems like Weights & Biases or Arize AI. This allows you to track retrieval accuracy over time and correlate it with final answer quality. For generation, you need to capture the full prompt context (including retrieved chunks), the LLM provider response (with token usage and latency), and the final parsed output. LangChain's callbacks and tracers (like LangSmith) are designed to emit this telemetry, which should be routed to a centralized observability platform.
The implementation pattern involves decorating your LangChain Chains and Agents with callback handlers that serialize execution traces into a structured format (JSON) and publish them to a message queue (e.g., AWS Kinesis, Google Pub/Sub). A downstream consumer service then validates, enriches, and forwards this data to the appropriate LLMOps destinations: experiment tracking to W&B, performance monitoring to Arize AI, and compliance logs to Credo AI. This decoupled architecture ensures low-latency inference while providing a complete audit trail. Crucially, you must also instrument the data ingestion and indexing pipeline that feeds your vector store, logging chunk statistics and embedding drift to catch data quality issues before they impact retrieval.
Rollout should follow a phased approach: start by instrumenting a single, high-value RAG workflow (e.g., internal knowledge base Q&A) and validate that the telemetry provides actionable insights for debugging a poor answer. Governance is enforced by integrating with policy engines; for example, you can configure Credo AI to scan logged prompts and outputs for PII, blocking any data containing sensitive information from being stored in the telemetry system. Finally, establish alerting on key metrics like a rising fallback_rate (indicating retrieval failures) or a spike in hallucination_score (from your LLM-as-a-judge evaluations in Arize), routing alerts to the on-call AI engineer. This architecture turns your LangChain application from a black box into a observable, optimizable system.
LANGCHAIN RAG PIPELINES
Code Patterns for RAG Instrumentation
Monitoring Retrieval Quality
Instrumenting the retriever is critical for diagnosing RAG failures. Log each query, the top-k retrieved chunks, and their relevance scores. This enables tracking metrics like Mean Reciprocal Rank (MRR) or chunk precision to evaluate if your vector store is returning useful context.
Use a custom LangChain callback handler to capture this data and send it to your observability platform (e.g., Arize AI, Weights & Biases). This pattern helps identify when to re-index documents or adjust chunking strategies.
python# Example: Custom callback to log retrieval details from langchain.callbacks.base import BaseCallbackHandler class RetrievalLogger(BaseCallbackHandler): def on_retriever_end(self, documents, **kwargs): # Log query, document IDs, and scores log_payload = { "query": kwargs.get("query"), "retrieved_ids": [doc.metadata.get("id") for doc in documents], "scores": [doc.metadata.get("score", 0.0) for doc in documents] } # Send to monitoring service monitoring_client.log_retrieval(log_payload)
LANGCHAIN RAG PIPELINE GOVERNANCE
Operational Impact: Before and After Instrumentation
How integrating observability and governance platforms transforms the management of LangChain-based RAG systems from reactive troubleshooting to proactive, data-driven operations.
| Metric | Before AI Governance | After AI Governance | Notes |
|---|---|---|---|
Issue Detection Time | Days to weeks via user complaints | Minutes to hours via automated alerts | Arize AI or W&B detects drift, latency spikes, or quality drops |
Root Cause Analysis | Manual log sifting across multiple systems | Drill-down to specific retrievers, chunks, or prompts | Arize RCA or W&B lineage traces poor output to source |
Prompt/Model Change Rollout | Manual, high-risk deployments | Canary releases with A/B testing and automatic rollback | Integrated with W&B experiments and Arize model comparison |
Cost Attribution & Forecasting | Monthly invoice surprises | Per-project, per-model token tracking and trend analysis | W&B cost tracking linked to specific chains and agents |
Compliance Evidence Gathering | Manual spreadsheet compilation for audits | Automated audit trails from deployment to inference | Credo AI aggregates logs from LangSmith, W&B, and Arize |
Retrieval Accuracy Optimization | Periodic manual testing on sample queries | Continuous monitoring of chunk relevance and answer quality scores | Arize LLM evaluation tracks embedding drift and top-k relevance |
Mean Time to Resolution (MTTR) | High variability based on engineer familiarity | Standardized playbooks with pre-integrated diagnostic data | Alerts include links to relevant W&B runs and Arize segments |
PRODUCTION-READY RAG OPERATIONS
Governance, Security, and Phased Rollout
A practical framework for deploying, governing, and scaling LangChain RAG pipelines with enterprise-grade controls.
Production LangChain RAG deployments require governance at three layers: data ingestion, retrieval & generation, and output delivery. For ingestion, implement data lineage tracking by tagging each document chunk with its source URI, ingestion timestamp, and a hash of its original content. This enables audit trails for compliance inquiries and allows you to trace a problematic LLM response back to the specific source document. Secure your vector store (e.g., Pinecone, Weaviate) with role-based access control (RBAC), ensuring that sensitive document indexes are only queryable by authorized agents or user groups. At the retrieval layer, log every query, the top-k retrieved chunks (with relevance scores), and the final synthesized answer. This data feeds into systems like Arize AI or Weights & Biases for monitoring retrieval accuracy (chunk relevance) and answer quality (hallucination rates, business outcome correlation).
A phased rollout mitigates risk. Start with a shadow mode where the RAG pipeline runs in parallel with existing search or support workflows, logging outputs without affecting users. Use this phase to establish performance baselines and tune chunking strategies. Next, move to a closed beta with a limited user group and a human-in-the-loop review step for low-confidence answers (e.g., low retrieval score or high answer variance). Finally, implement canary deployments for any changes to prompts, LLM models, or embedding models, routing a small percentage of traffic to the new version while monitoring key metrics for regression. Integrate these deployment gates with your CI/CD pipeline and a model registry like W&B Model Registry to enforce version control and staged promotions.
Security is non-negotiable. Implement input sanitization and output guardrails to prevent prompt injection and data leakage. For pipelines handling PII or PHI, use a dedicated, isolated vector namespace and consider implementing a query rewriting step that redacts sensitive terms before the retrieval call. All LLM interactions should be logged with user IDs and session tokens for forensic analysis. Finally, establish a runbook for incidents—such as a spike in retrieval failures or a degradation in answer quality—that defines clear escalation paths, rollback procedures, and communication protocols. This operational discipline transforms a prototype RAG chain into a reliable, governed enterprise system. For related patterns on managing the full LLM lifecycle, see our guides on AI Integration for LangChain Tracing and Evaluation and AI Integration with Credo AI for Controlled AI Operations.
Enabling Efficiency, Speed & Accuracy
Intelligent Analysis, Decision & Execution
We build AI systems for teams that need search across company data, workflow automation across tools, or AI features inside products and internal software.
Talk to Us
Search across company data
Give teams answers from docs, tickets, runbooks, and product data with sources and permissions.
Useful when people spend too long searching or get different answers from different systems.
Enterprise searchRAGPermissions
Read more
Automate internal workflows
Use AI to route work, draft outputs, trigger actions, and keep approvals and logs in place.
Useful when repetitive work moves across multiple tools and teams.
AI agentsWorkflow automationGovernance
Read more
Add AI to products and internal tools
Build assistants, guided actions, or decision support into the software your team or customers already use.
Useful when AI needs to be part of the product, not a separate tool.
AI integrationDecision supportModel routing
Read moreFOR LANGCHAIN RAG PIPELINES
FAQ: RAG Observability and Instrumentation
Practical questions for teams deploying Retrieval-Augmented Generation systems with LangChain, focusing on production monitoring, troubleshooting, and governance.
Beyond standard LLM metrics (latency, cost, error rate), you must instrument the retrieval layer. Key metrics include:
- Retrieval Precision/Recall: How many of the returned chunks are relevant to the query? Track this with ground truth or LLM-as-a-judge evaluations.
- Chunk Relevance Score: The similarity score (e.g., cosine) between the query embedding and the retrieved chunk embedding. Monitor its distribution for drift.
- Answer Faithfulness/Hallucination Rate: Does the final answer stay grounded in the retrieved context? Use entailment or custom classifiers.
- Context Utilization: The proportion of the provided context tokens the LLM actually uses in its response. Low utilization may indicate poor retrieval.
- Retrieval Latency: Time spent on embedding generation and vector search, separate from LLM generation time.
- Cache Hit Rate: If using a semantic cache for frequent queries.
Instrument these by adding LangChain callback handlers to log each step to platforms like Arize AI or Weights & Biases.

About the author
Prasad Kumkar
CEO & MD, Inference Systems
Prasad Kumkar is the CEO & MD of Inference Systems and writes about AI systems architecture, LLM infrastructure, model serving, evaluation, and production deployment. Over 5+ years, he has worked across computer vision models, L5 autonomous vehicle systems, and LLM research, with a focus on taking complex AI ideas into real-world engineering systems.
His work and writing cover AI systems, large language models, AI agents, multimodal systems, autonomous systems, inference optimization, RAG, evaluation, and production AI engineering.
LinkedIn
Limited slotsGet a Free AI Consultation
Partnered with leading AI, data, and software stack.


How We Work
Custom AI workflows for your Business
One-fit-all AI don't work for modern businesses. At Inferensys, we aim to understand your business & custom requirements; which we use to define most efficient agentic workflows, the data, and the tools for your business.
01
Review the use case
We understand the task, the users, and where AI can actually help.
Read more02
Pick the right approach
We define what needs search, automation, or product integration.
Read more03
Build the first useful version
We implement the part that proves the value first.
Read more04
Improve from there
We add the checks and visibility needed to keep it useful.
Read moreThe first call is a practical review of your use case and the right next step.
Talk to Us