Inferensys

Integration

AI Integration for Arize AI Integration APIs

Programmatically connect custom LLM applications, RAG pipelines, and agentic workflows to Arize AI's monitoring platform using its robust APIs. Enable production-grade observability, drift detection, and performance analysis for distributed AI systems.
Developer building agentic RAG system, retrieval pipeline diagram on laptop, technical workspace with notes.
PROGRAMMATIC OBSERVABILITY FOR DISTRIBUTED AI

Where AI Monitoring Integrates with Your LLM Stack

Integrate Arize AI's monitoring APIs directly into your custom applications and microservices to instrument, evaluate, and govern production LLM workflows.

Arize AI's integration APIs are designed for custom applications, microservices, and agentic workflows that sit outside of managed platforms. You send data programmatically via its phoenix client or direct REST API, typically from within your application's inference logic, RAG pipelines, or post-processing hooks. Key integration points include:

  • Inference Logging: Emit prompts, completions, metadata (model, version), token usage, and latency from your LLM service wrapper or orchestration layer (e.g., LangChain, LlamaIndex, custom agents).
  • Ground Truth & Feedback: Send business outcomes (e.g.,
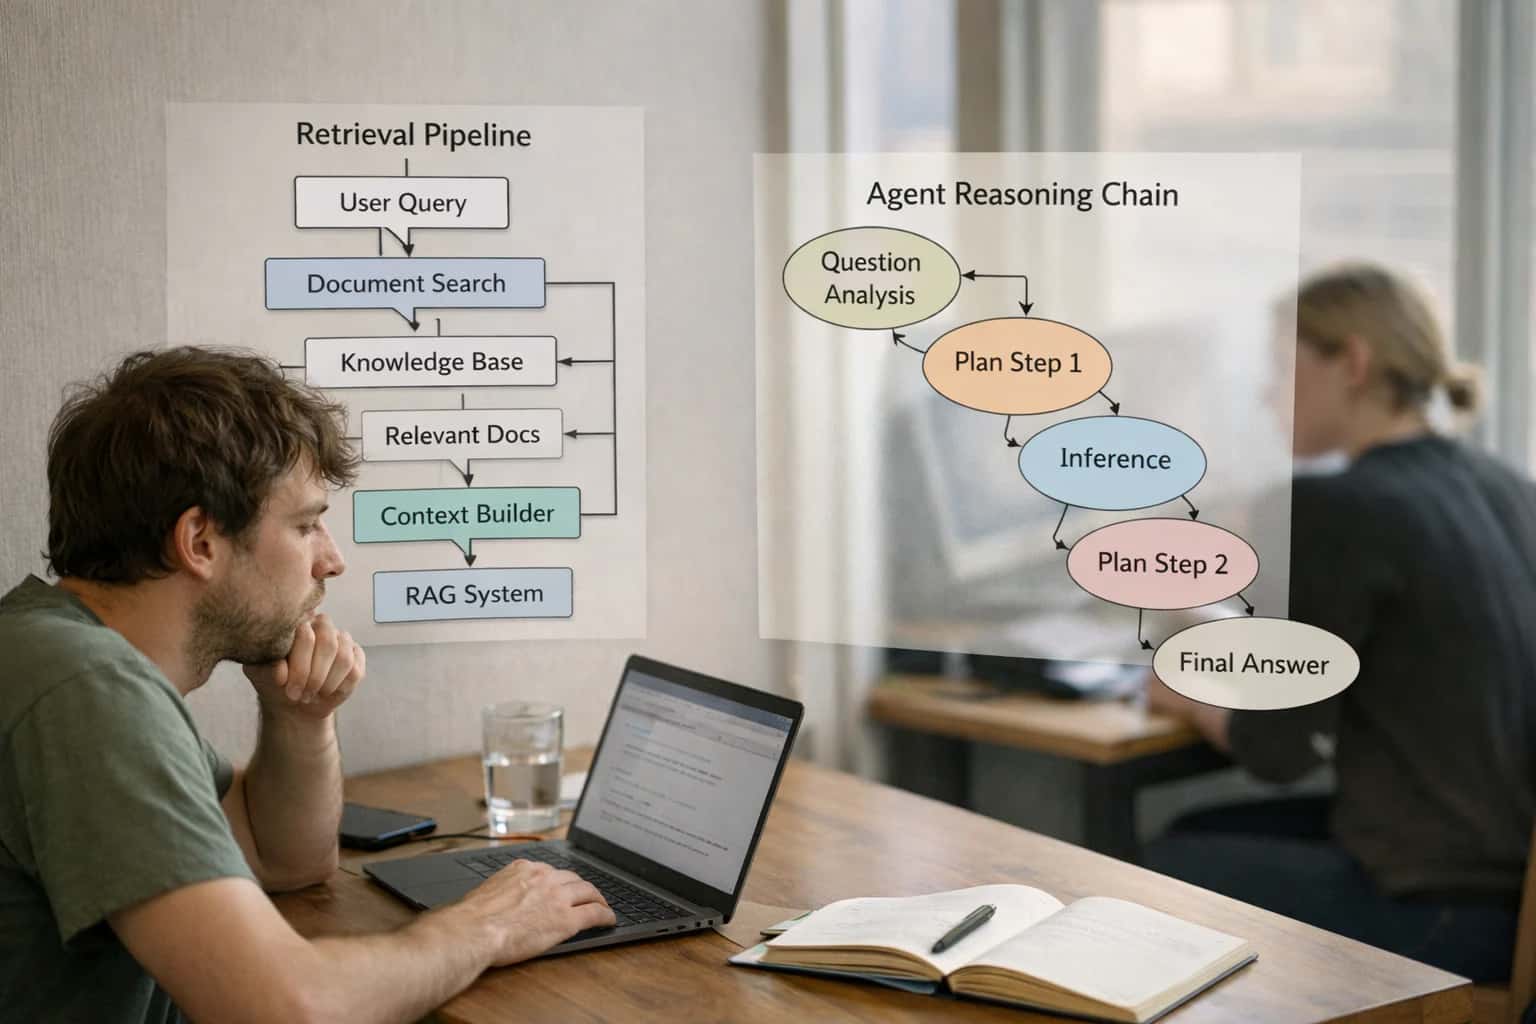
 deal_won, ticket_resolved) and human ratings to correlate LLM outputs with real-world results.
  • Embedding & Retrieval Monitoring: Log queries, retrieved document chunks, and similarity scores from your vector database to track RAG performance drift.

For production rollout, you architect a dedicated telemetry service or sidecar that batches and forwards observability payloads to Arize's ingestion endpoints. This avoids blocking your primary application flow. Implement this alongside your existing logging and APM infrastructure (Datadog, New Relic). Governance is enforced via code review for new metric definitions and RBAC on Arize projects to control who can create alerts or modify dashboards. A common pattern is to use a shared internal SDK or decorator that standardizes logging fields (team, environment, use case) across all your AI services.

This integration matters because it shifts monitoring from a manual, dashboard-centric activity to an automated, pipeline-native function. By baking Arize's APIs into your CI/CD and deployment workflows, you enable:

  • Automated Canary Analysis: Compare metrics for a new model/prompt version against a baseline immediately post-deployment.
  • Centralized RCA: Drill from a high-level SLO breach (e.g., relevance score drop) down to specific failing endpoints or user segments.
  • Governance-as-Code: Define data quality rules and performance thresholds in configuration, triggering alerts to PagerDuty or creating Jira tickets for model retraining.

Without this integration, teams are left with siloed logs and reactive firefighting, unable to trace a poor business outcome back to a specific model change, data drift, or retrieval failure.

PROGRAMMATIC INTEGRATION POINTS

Key Arize AI API Surfaces for LLM Telemetry

Core Logging APIs for Production LLMs

The log and bulk_log endpoints are the primary surfaces for sending prediction data and ground truth to Arize AI. This is essential for monitoring model performance, calculating metrics, and detecting drift.

Key Payloads:

  • Prediction Records: Send the LLM's prompt, response, model name/version, latency, token usage, and any extracted features (e.g., user intent, retrieved document IDs).
  • Actuals (Ground Truth): Submit the correct or user-provided feedback (thumbs up/down, corrected answer) later via a separate API call using a shared prediction_id. This enables calculation of accuracy, relevance scores, and business KPIs.
  • Tags & Metadata: Attach dimensions like environment (prod/staging), user_cohort, or conversation_id to segment and analyze performance.

Integration Pattern: Instrument your LLM service's inference endpoint or wrap your LangChain/Custom chain execution to call the Arize logging client asynchronously after each generation.

ARIZE AI INTEGRATION APIS

High-Value Use Cases for API-Driven Monitoring

Programmatically connect Arize AI to your custom LLM applications and microservices for production-grade observability. These patterns enable teams to monitor complex, distributed AI architectures without manual instrumentation.

01

Unified Performance Dashboards for Multi-Model Architectures

Send inference data from multiple LLM providers (OpenAI GPT-4, Anthropic Claude, Cohere Command) and self-hosted models (Llama, Mistral) to a single Arize AI project. Correlate latency, cost, and quality metrics across vendors to optimize routing logic and manage spend. Workflow: API calls from your orchestration layer include model version, token counts, and custom metadata, enabling apples-to-apples comparison in Arize.

Batch -> Real-time
Metric consolidation
02

Automated Drift Detection for RAG Pipelines

Instrument your retrieval-augmented generation system by sending query embeddings, retrieved chunk IDs, and final answer quality scores via Arize's APIs. Monitor for embedding drift in user questions and semantic drift in your knowledge base to trigger re-indexing. Workflow: Post-inference payloads include the vector used for search and the relevance score of top chunks, enabling Arize to track retrieval health over time.

Proactive Alerts
vs. reactive debugging
03

Business Outcome Correlation for AI Products

Link LLM outputs to downstream business events. Send prediction IDs with Arize's APIs, then later post ground truth (e.g., 'lead converted', 'ticket resolved') to calculate ROI-centric metrics like support deflection rate or sales qualification accuracy. Workflow: Your application stores a prediction ID, which is sent to Arize. A separate batch job pushes business outcomes, closing the loop on value measurement.

Same day
Impact visibility
04

Centralized LLM Evaluation & LLM-as-Judge Logging

Automate quality scoring by sending LLM-generated answers and their evaluation results (from GPT-4 as a judge, custom rubric scores) to Arize. Track hallucination rates, guideline adherence, and safety scores across prompts and model versions. Workflow: Your evaluation pipeline calls the Arize API to log the prompt, completion, and automated score, creating a centralized record for prompt engineering iterations.

1 sprint
Prompt iteration cycle
05

Segment Analysis for High-Stakes Regulatory Compliance

For regulated use cases (lending, healthcare), tag inferences with segment keys (e.g., region, product line, demographic cohort) via API metadata. Use Arize to monitor for performance disparities or bias across segments, generating auditable reports for compliance teams. Workflow: Your application adds context tags to each API call to Arize, enabling slicing dashboards and alerts by segment without post-hoc joins.

Audit-ready
Reporting
06

Microservice & Distributed Tracing Integration

In a microservices architecture where LLM calls are one step in a broader workflow, use Arize's APIs to trace an end-to-end request ID. Log latency and errors from pre-processing, model calls, post-processing, and tool execution to pinpoint bottlenecks. Workflow: Propagate a correlation ID through your system, with each service logging its span to Arize, providing a unified view of complex agentic workflows.

Hours -> Minutes
Root cause isolation
PRODUCTION LLMOPS PATTERNS

Example API Integration Workflows

Integrating Arize AI's APIs enables programmatic observability for custom LLM applications. These workflows detail how to instrument inference logging, feedback collection, and monitoring automation for production-grade AI systems.

This workflow ensures every LLM interaction in a live agent is captured for performance monitoring and cost analysis.

  1. Trigger: A user query is processed by your custom LLM application (e.g., a chatbot built with LangChain).
  2. Context/Data Pulled: Your application bundles the following into a payload:
    • prediction_id: A unique UUID for the interaction.
    • prompt: The exact user message and system prompt.
    • response: The full LLM completion.
    • model_name: The LLM provider and model version used (e.g., gpt-4-turbo).
    • latency: Inference time in milliseconds.
    • token_usage: Prompt and completion tokens.
    • session_id and user_id for segmentation.
  3. API Action: Your application makes a synchronous POST call to the Arize AI log API endpoint immediately after receiving the LLM response.
  4. System Update: Arize AI ingests the log, making the data instantly available for dashboards and real-time alerting on metrics like latency spikes or error rates.
  5. Human Review Point: If the response confidence score (calculated by your app) is below a threshold, the prediction_id is also sent to a separate review queue for human evaluation. The human's rating later becomes the ground truth sent via Arize's feedback API.

Example Payload Snippet:

json
{
  "prediction_id": "chat_abc123",
  "prompt": "What is your return policy?",
  "response": "Our standard return window is 30 days...",
  "model_name": "anthropic.claude-3-sonnet",
  "latency_ms": 1250,
  "prompt_tokens": 45,
  "completion_tokens": 89
}
FROM DEVELOPMENT TO PRODUCTION GOVERNANCE

Implementation Architecture: Building a Reliable Telemetry Pipeline

A production-ready LLM integration requires a robust pipeline to capture, route, and analyze inference data for observability and governance.

A reliable telemetry pipeline for Arize AI starts at the application layer. In your custom applications, microservices, or agent frameworks (like LangChain), you instrument key points to capture inference payloads, model responses, latency, token usage, and custom business metadata. This data is sent asynchronously via Arize's phoenix.client SDK or REST API to avoid blocking user-facing requests. For high-volume systems, implement a buffering queue (e.g., Kafka, Amazon SQS) to decouple your application from the monitoring service, ensuring resilience during Arize API outages or network spikes.

The architecture must handle multi-tenant data segregation and schema evolution. Use Arize's tagging system (e.g., model_id, environment, user_segment) to slice performance data. For Retrieval-Augmented Generation (RAG) applications, extend the payload to include retrieval context—such as document IDs and similarity scores—enabling Arize to monitor retrieval quality drift alongside LLM response quality. Integrate this pipeline with your CI/CD system to automatically register new model versions and prompt templates in Arize, linking deployments directly to performance baselines.

Rollout and governance are critical. Start by shadowing production traffic, logging inferences to Arize without impacting user responses, to establish a performance baseline. Implement sampling strategies for high-volume, low-risk queries to manage cost, while logging 100% of inferences for high-stakes workflows (e.g., financial advice, clinical support). Finally, wire Arize's alerting to your incident management platform (PagerDuty, Opsgenie) and configure role-based access controls (RBAC) so that AI engineers see granular tracing data, while product managers view business KPIs and compliance officers access audit trails. This layered approach ensures the telemetry pipeline supports both operational debugging and long-term governance, as detailed in our guide on AI Governance and LLMOps Platforms.

SENDING DATA TO ARIZE AI

Code and Payload Examples

Logging Inference and Feedback

The Arize AI Python SDK is the primary method for sending data from your application. You log a prediction with model inputs and outputs, and later log the actual outcome (ground truth) to calculate performance metrics.

python
import arize
from arize.utils.types import ModelTypes, Environments

# Initialize the client
client = arize.Client(api_key=os.environ['ARIZE_API_KEY'], space_key=os.environ['ARIZE_SPACE_KEY'])

# Log a prediction (inference)
prediction_id = "chat_req_12345"
response = client.log(
    model_id="prod-customer-support-llm",
    model_type=ModelTypes.GENERATIVE_LLM,
    environment=Environments.PRODUCTION,
    prediction_id=prediction_id,
    prediction_label="The estimated delivery date is 3-5 business days.",
    features={
        "user_query": "When will my order arrive?",
        "order_value": 149.99,
        "customer_tier": "premium"
    },
    embedding_features={
        "retrieved_context": {
            "vector": [0.1, 0.2, ...], # Your document embedding
            "data": "Your order #456 shipped on 10/24..."
        }
    }
)

# Later, log the actual outcome (ground truth)
feedback = client.log(
    model_id="prod-customer-support-llm",
    model_type=ModelTypes.GENERATIVE_LLM,
    environment=Environments.PRODUCTION,
    prediction_id=prediction_id, # Match the prediction
    actual_label="Customer confirmed delivery on 10/29."
)
INTEGRATING ARIZE AI APIS INTO LLM WORKFLOWS

Operational Impact and Time Savings

This table illustrates the shift from manual, reactive LLM operations to automated, data-driven governance by integrating Arize AI's APIs into your application and MLOps pipelines.

MetricBefore AIAfter AINotes

Performance Issue Detection

Days to weeks via user reports

Minutes via automated drift & anomaly alerts

Proactive detection of model degradation or data quality shifts

Root Cause Analysis

Manual log sifting across systems

Segmented analysis and feature attribution in one dashboard

Engineers isolate problematic data slices or model versions faster

Model Deployment Validation

Ad-hoc spot checks post-release

Automated A/B testing with statistical significance

Confidence in rollout decisions backed by business metric comparisons

Compliance Evidence Collection

Manual spreadsheet and screenshot assembly

Automated audit trails of inputs, outputs, and policy checks

Streamlines reporting for frameworks like NIST AI RMF or EU AI Act

Evaluation & Scoring Workflow

Batch script runs, manual result aggregation

Continuous LLM-as-a-judge and custom metric pipelines

Centralized quality scores for product owners and operations teams

Cost Attribution & Visibility

Monthly bill review, rough team estimates

Per-project, per-model token usage and cost tracking

Enables FinOps and budget forecasting for AI initiatives

Incident Response Time

Hours to triage and assemble context

Minutes with integrated alerts, dashboards, and RCA tools

On-call engineers have precise context for service degradation

PRODUCTION ARCHITECTURE FOR MONITORED LLMS

Governance, Security, and Phased Rollout

A practical blueprint for integrating Arize AI's APIs into a governed, secure LLM deployment pipeline.

Integrating Arize AI begins by instrumenting your LLM application code—whether built with LangChain, LlamaIndex, or custom frameworks—to call the Arize log and feedback APIs. This sends inference payloads (prompts, responses, metadata) and optional ground truth to Arize's cloud. For security, API keys are managed via environment variables or a secrets manager, and all data in transit is encrypted. A critical architectural decision is determining which data points are essential for monitoring (e.g., prompt, response, model_version, latency, user_id) and which contain sensitive data that should be excluded or pseudonymized before logging to comply with data privacy policies.

Governance is enforced through Arize's platform by configuring monitors and alerts. You can set up drift detection on embedding distributions for your RAG system, create custom metrics to track business KPIs like support deflection rate, and establish anomaly detection on error rates or latency spikes. These monitors should be integrated with your incident management system (e.g., PagerDuty, Slack) to create a closed-loop AIOps workflow. For auditability, ensure your logging includes a trace_id that links the Arize observation back to your application's own request logs and any associated human review tickets in systems like Jira.

A phased rollout mitigates risk. Start by instrumenting a single, non-critical LLM workflow (e.g., an internal knowledge assistant) and sending data to a dedicated Arize sandbox project. Validate that data appears correctly in dashboards and that alerts fire as expected. Next, expand to all staging environments, using Arize to compare the performance of new model versions or prompt changes against baselines before production promotion. Finally, roll out to production workloads in tiers, beginning with low-risk user segments. This staged approach allows your team to refine monitoring thresholds, data pipelines, and response playbooks without impacting core business operations.

ARIZE AI INTEGRATION APIS

Frequently Asked Questions

Common technical and operational questions about programmatically integrating LLM observability into your applications using Arize AI's APIs.

The integration flow involves instrumenting your application code to log key data points to Arize's APIs. A standard production pattern includes:

  1. Trigger: Your application calls an LLM (e.g., OpenAI, Anthropic) or executes a RAG pipeline.
  2. Context Logging: Immediately after the call, your code sends a payload to Arize's /log endpoint. This payload should include:
    • prediction_id: A unique identifier for the inference.
    • features: The user query/prompt and any relevant metadata (user_id, session_id, model_name).
    • prediction: The raw LLM completion text.
    • actual (if available): The ground truth or human-rated score for the response, sent later via a separate feedback loop.
  3. Async Feedback Loop: When a human reviews the output or a business outcome is known (e.g., customer resolved their issue), your system sends an update to the same prediction_id via the /log endpoint with the actual field populated.
  4. Monitoring: Arize AI processes this data to calculate metrics, detect drift, and power dashboards.

Example Payload Snippet:

json
{
  "prediction_id": "chat_abc123",
  "timestamp": 1712092800,
  "model_type": "llm",
  "model_version": "gpt-4-turbo-2024-04-09",
  "features": {
    "prompt": "How do I reset my password?",
    "user_tier": "premium"
  },
  "prediction": "To reset your password, please visit the account settings page...",
  "actual": null // To be populated later
}
Prasad Kumkar

About the author

Prasad Kumkar

CEO & MD, Inference Systems

Prasad Kumkar is the CEO & MD of Inference Systems and writes about AI systems architecture, LLM infrastructure, model serving, evaluation, and production deployment. Over 5+ years, he has worked across computer vision models, L5 autonomous vehicle systems, and LLM research, with a focus on taking complex AI ideas into real-world engineering systems.

His work and writing cover AI systems, large language models, AI agents, multimodal systems, autonomous systems, inference optimization, RAG, evaluation, and production AI engineering.