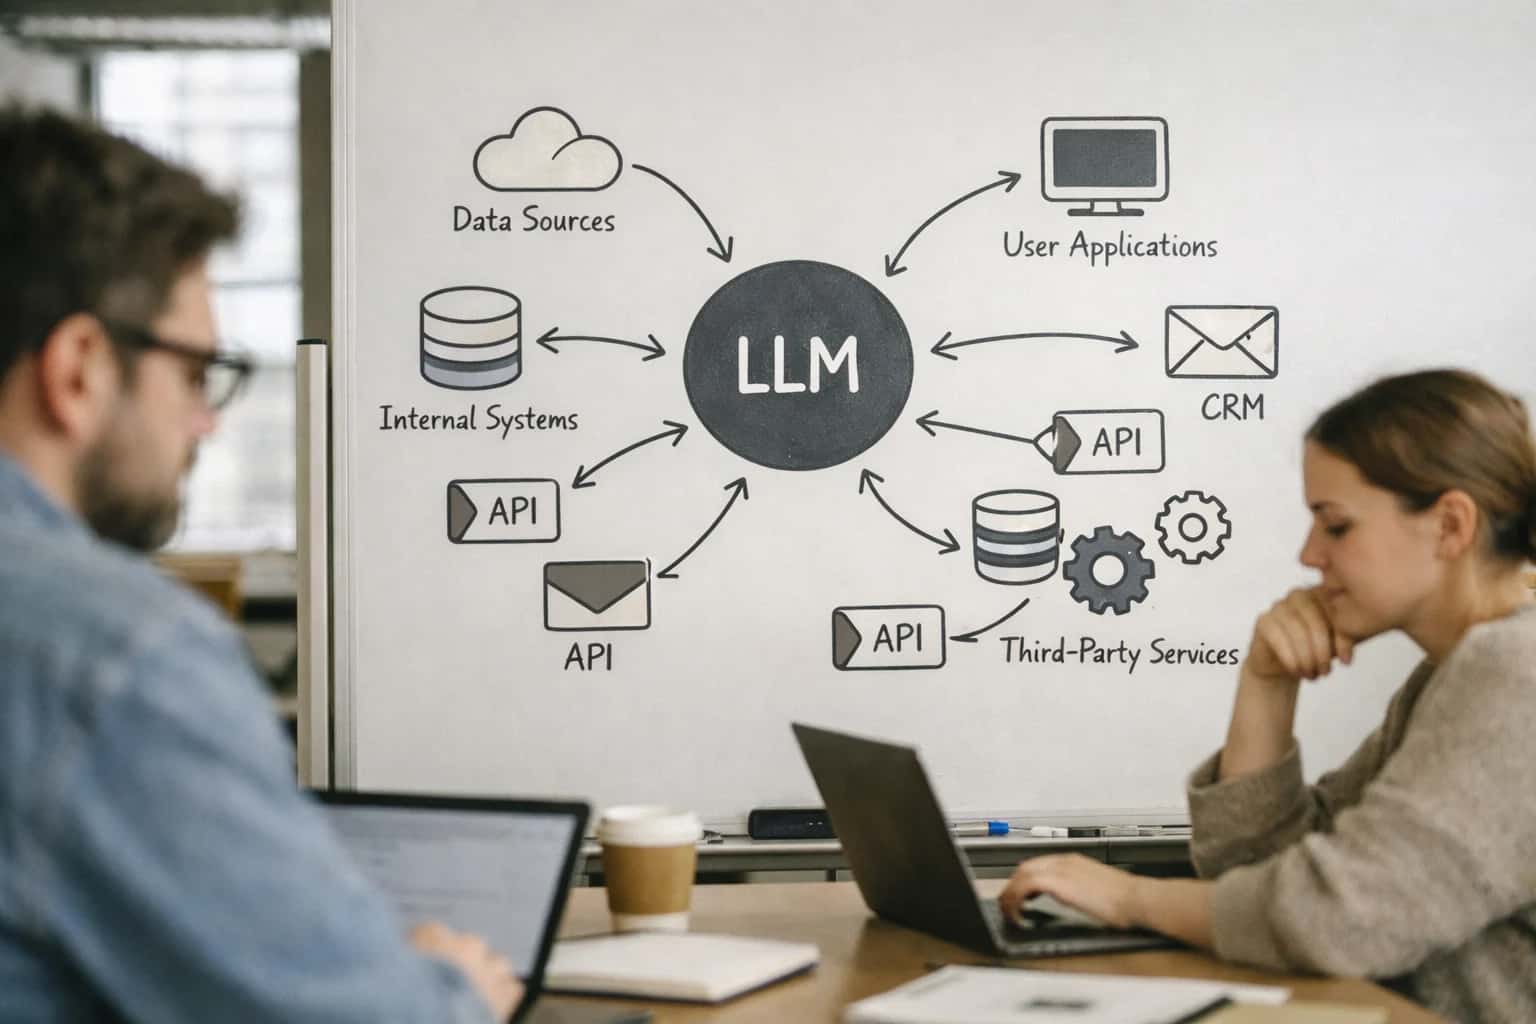
AI connects to QuickBooks' financial data primarily through its Reporting API and Data Query endpoints. The integration targets key surfaces: the Profit & Loss, Balance Sheet, and Cash Flow reports, as well as underlying transactional data like Journal Entries, Invoices, and Bills. By querying this data on a scheduled or on-demand basis, an AI system can analyze trends, calculate key ratios (e.g., gross margin, current ratio), and compare actuals to budget or prior period figures stored in QuickBooks classes, locations, or custom fields.
Integration
AI Financial Reporting for QuickBooks
Architecture for AI systems that generate narrative financial reports, executive summaries, and variance explanations by querying QuickBooks data via its reporting API.
ARCHITECTURE AND ROLLOUT
Where AI Fits into QuickBooks Financial Reporting
A practical blueprint for augmenting QuickBooks' reporting engine with AI to generate narrative insights, executive summaries, and variance explanations.
The core workflow involves the AI retrieving raw report data, applying financial logic to identify significant variances (e.g., "COGS increased 15% while revenue grew 5%"), and then generating a plain-language narrative. This narrative can be formatted as an executive summary email, appended as a note to the report in QuickBooks, or pushed to a BI dashboard like Power BI. For implementation, this typically requires a middleware layer (like a secure cloud function) that handles authentication via OAuth 2.0, manages API rate limits, and orchestrates the sequence: 1) data fetch, 2) AI analysis and drafting, 3) optional human review, and 4) delivery back to QuickBooks or another system.
Rollout should start with a single, high-value report—often the monthly P&L—for a pilot department or entity. Governance is critical: establish audit trails logging all AI-generated insights alongside the source data snapshots. Implement approval workflows where a controller or CFO can review and edit the AI's narrative before distribution. This controlled, phased approach de-risks the integration and builds trust by demonstrating consistent, accurate, and actionable reporting augmentation without disrupting the core bookkeeping workflows that finance teams rely on.
ARCHITECTURE BLUEPRINT
Key QuickBooks APIs and Data Surfaces for AI Reporting
Core Data Access for AI
AI financial reporting systems primarily interact with QuickBooks via its Reporting API and Query API. The Reporting API provides pre-built financial statements (Profit & Loss, Balance Sheet, Cash Flow) and transaction lists, which are ideal for generating executive summaries and variance explanations. For more granular analysis, the Query API (via the query endpoint) allows custom SQL-like queries against QuickBooks objects like Invoice, Bill, JournalEntry, and Account.
An AI agent for narrative reporting would typically:
- Call the Reporting API to fetch standard financials for a period.
- Use the Query API to drill into specific accounts or transaction types flagged for review.
- Combine this data with metadata (e.g.,
Customer,Vendor,Class) to add business context.
This two-tiered approach ensures the AI has both the summarized view for high-level reporting and the detailed transaction-level data needed to explain anomalies or trends.
PRACTICAL INTEGRATION PATTERNS
High-Value AI Reporting Use Cases for QuickBooks
Move beyond static reports. These AI integration patterns connect to QuickBooks' reporting API and data model to generate narrative insights, automate analysis, and deliver actionable financial intelligence directly within your existing workflows.
01
Automated Executive Summary Generation
AI agents query the QuickBooks Reports API (Profit & Loss, Balance Sheet, Cash Flow) on a scheduled basis, then generate a plain-language narrative summary. This highlights key variances, top-line performance, and cash position changes, emailed to leadership each Monday morning.
Hours -> Minutes
Report preparation
02
Variance Explanation & Root-Cause Analysis
Integrate AI to monitor budget vs. actuals. When a significant variance is detected in a category like Cost of Goods Sold or Marketing Expense, the system automatically drills into underlying transactions and vendor records to suggest a cause (e.g., '22% increase linked to Vendor X invoices in Q2').
Batch -> Real-time
Anomaly detection
03
Role-Specific Departmental Dashboards
Build AI-powered dashboards that filter and summarize QuickBooks data by Class, Location, or Customer dimensions. For example, automatically generate a one-page report for a department head showing their budget utilization, outstanding PO commitments, and upcoming recurring expenses.
1 sprint
Typical implementation
04
Client-Facing Financial Package Automation
For accounting firms and fractional CFOs, AI assembles tailored client packages. It pulls standardized reports from QuickBooks, injects client-specific commentary on performance trends, and formats into a branded PDF or PowerPoint deck, ready for review meetings.
Same day
Package turnaround
05
Cash Flow Forecast Narrative
Beyond a simple forecast chart, AI analyzes open Invoices (Accounts Receivable), Bills (Accounts Payable), and historical payment patterns from QuickBooks to produce a written forecast narrative. It flags potential shortfalls and suggests actions like 'Prioritize collection on Invoice #1001 due next week.'
06
Audit & Review Support Packets
During audit season, AI compiles supporting documentation. Given a sample of journal entries or transactions selected by an auditor, it retrieves the full audit trail from QuickBooks, finds linked documents (e.g., uploaded receipts or invoices), and generates a concise summary packet for each item.
PRACTICAL IMPLEMENTATION PATTERNS
Example AI Reporting Workflows for QuickBooks
These workflows illustrate how AI agents connect to QuickBooks Online's reporting and transaction APIs to automate narrative analysis, variance explanation, and executive summary generation. Each pattern is designed to be triggered by schedule, user request, or data change.
This workflow generates a plain-language summary of monthly performance for leadership, pulling data from multiple QuickBooks reports.
Trigger: Scheduled job on the 2nd business day of the new month.
Context/Data Pulled:
- Profit & Loss Detail report for the prior month and same month last year.
- Balance Sheet Summary as of month-end.
- A/R Aging Detail and A/P Aging Detail reports.
- Sales by Customer Summary for the prior month.
Model/Agent Action:
- The AI system queries the QuickBooks Reports API for the structured data above.
- A prompt instructs the LLM to analyze key metrics: revenue vs. prior month and YoY, top expense categories, net income change, cash position, and aging highlights.
- The model generates a 3-paragraph executive summary, highlighting significant variances (e.g., "Marketing expenses increased 15% due to the Q3 campaign launch") and potential risks (e.g., "A/R over 60 days grew by $12,000, concentrated in Customer X").
System Update/Next Step:
- The summary is formatted into an HTML email.
- The system uses QuickBooks' Company Info API to retrieve the company name and primary contact email.
- The email is sent to a pre-configured distribution list (e.g., CEO, CFO, COO).
- A link to the full QuickBooks report package is included.
Human Review Point: Optional. The summary can be first sent to the Controller for a quick review/editing interface before being forwarded to executives.
FROM DATA TO NARRATIVE INSIGHTS
Implementation Architecture: Data Flow, APIs, and Guardrails
A production-ready architecture for generating automated financial reports by securely querying and interpreting QuickBooks data.
The core of this integration is the QuickBooks Data API (v3) and the newer Reports API. The system first extracts raw financial data—typically the Profit and Loss, Balance Sheet, and Cash Flow statements—along with dimensional data from Classes, Locations, or Custom Fields. This data is pulled on a scheduled basis (e.g., nightly post-close) or triggered via webhook for real-time reporting needs. The extracted JSON or CSV payloads are then normalized and enriched with metadata (e.g., period comparisons, budget variances) in a middleware layer before being sent to the LLM for analysis.
The AI processing engine uses a Retrieval-Augmented Generation (RAG) pattern. The normalized financial data is chunked and indexed in a vector database alongside company-specific context like prior report narratives, accounting policies, and key performance indicator definitions. When generating a report, the LLM query retrieves this grounded financial context to ensure all narrative explanations—such as variance commentary on "Cost of Goods Sold increased by 15%"—are factually accurate and reference the correct GL accounts. The final output is structured JSON containing the narrative summary, bulleted insights, and recommended action items, which is then formatted into PDF, emailed to stakeholders, or posted back to a QuickBooks Notes or Custom Field for record-keeping.
Critical guardrails are implemented at each stage. Data access is scoped using QuickBooks OAuth 2.0 with the minimal required permissions (com.intuit.quickbooks.accounting). All LLM prompts are templated and validated to prevent instruction manipulation, and outputs undergo a fact-checking step where key figures (e.g., net profit, revenue growth) are programmatically verified against the source data. A human-in-the-loop approval step can be configured for final reports before distribution, with all activities logged to an audit trail linking the generated narrative back to the source QuickBooks report ID and data pull timestamp for full traceability.
AI FINANCIAL REPORTING WORKFLOWS
Code and Payload Examples
Fetching Financial Data for Analysis
Before generating a narrative report, your AI system must retrieve structured financial data from QuickBooks. The QuickBooks Data API provides access to reports like Profit & Loss, Balance Sheet, and Cash Flow. Use OAuth 2.0 for authentication and specify the date range and accounting method.
A typical workflow involves:
- Authenticating and obtaining an access token.
- Calling the Reports API endpoint (e.g.,
ProfitAndLoss). - Parsing the JSON response to extract line items, amounts, and period comparisons.
This retrieved data forms the factual basis for the AI to generate summaries and explanations.
pythonimport requests # Example: Fetch Profit & Loss report for the last quarter def get_quickbooks_pl_report(access_token, company_id): url = f"https://quickbooks.api.intuit.com/v3/company/{company_id}/reports/ProfitAndLoss" headers = { "Authorization": f"Bearer {access_token}", "Accept": "application/json" } params = { "start_date": "2024-01-01", "end_date": "2024-03-31", "accounting_method": "Accrual" } response = requests.get(url, headers=headers, params=params) return response.json() # Contains structured rows and columns
AI-ASSISTED REPORTING VS. MANUAL PROCESSES
Realistic Time Savings and Business Impact
This table illustrates the operational impact of integrating an AI reporting system with QuickBooks via its API, focusing on the finance team's core reporting workflows.
| Reporting Workflow | Before AI (Manual) | After AI (Assisted) | Key Notes |
|---|---|---|---|
Monthly Executive Summary Generation | 4-8 hours of manual data pull, analysis, and narrative writing | 30-60 minutes for review and finalization of AI-generated draft | AI queries QB Reporting API, drafts narrative; finance lead edits for nuance and tone |
Variance Analysis (Actual vs. Budget/Forecast) | 2-3 hours per department or P&L line item to identify and explain discrepancies | AI pre-identifies top 5-10 variances with suggested explanations in minutes | Analyst reviews, validates, and incorporates AI insights into final management report |
Ad-hoc Financial Report Creation | 1-2 hours per request to build queries, format data, and create visuals | Natural language request returns formatted report with charts in 2-5 minutes | Uses conversational interface to query QuickBooks data; reduces backlog for finance team |
Quarterly Board Deck Financial Section | 1-2 days consolidating data from multiple reports and slides | AI compiles core financial slides from period data in 2-4 hours | Automates data aggregation and chart generation; strategist focuses on narrative and messaging |
Daily/Weekly KPI Dashboard Refresh | Manual export, spreadsheet manipulation, and chart updates (1 hour daily) | Automated refresh with AI highlighting anomalies and trends upon login | System pushes alerts on significant deviations (e.g., cash burn, margin drop) for immediate review |
Audit & Year-End Support Pack Preparation | Days spent gathering transaction samples and compiling supporting documentation | AI can pre-assemble common audit packs and sample sets in hours | Dramatically reduces prep time for auditors; ensures consistency and reduces risk of omission |
Client/Stakeholder Report Personalization | Manual customization of standard reports for each stakeholder (hours per client) | AI tailors narrative and highlights based on stakeholder role (CFO vs. Operations) in batch | Maintains personal touch at scale, crucial for accounting firms or businesses with multiple investors |
ARCHITECTING FOR PRODUCTION
Governance, Security, and Phased Rollout
A secure, governed approach to deploying AI financial reporting in QuickBooks.
Production AI reporting systems must operate within the same security and audit frameworks as your core financial data. This means implementing a read-only service account for the AI to access QuickBooks data via the Reporting API, ensuring no accidental writes or modifications. All AI-generated narratives should be stored as attachments or notes on the corresponding report object in QuickBooks, creating a clear, immutable audit trail. Access to the AI system itself should be gated by the same role-based permissions (e.g., Accountant, Company Admin) that control financial data access in QuickBooks, preventing unauthorized users from triggering sensitive report generation.
A phased rollout is critical for user adoption and risk management. Start with a pilot group of 2-3 power users (e.g., a Controller and a CFO) generating narrative summaries for standard reports like the Profit & Loss statement. In this phase, the AI acts as a drafting assistant, where outputs are reviewed, edited, and approved before final distribution. This allows for prompt tuning and validation of the AI's accuracy and tone. Phase two expands access to department heads for management reporting, automating the generation of variance explanations for budget vs. actuals. The final phase enables scheduled, automated distribution of AI-enhanced reports to stakeholders, with built-in human-in-the-loop approval steps for any narrative exceeding a defined confidence threshold or containing material variances.
Governance is maintained through continuous monitoring. Log all AI queries to the QuickBooks API, the generated narratives, and the user who approved them. Implement drift detection to flag if the AI's explanations begin to deviate significantly from historical patterns or accountant-reviewed samples. For financial close periods, consider implementing a change freeze on the AI's prompt logic to ensure consistency. This layered approach—combining strict API permissions, phased user enablement, and operational monitoring—ensures the AI integration enhances financial reporting without introducing compliance risk or operational instability.
Enabling Efficiency, Speed & Accuracy
Intelligent Analysis, Decision & Execution
We build AI systems for teams that need search across company data, workflow automation across tools, or AI features inside products and internal software.
Talk to Us
Search across company data
Give teams answers from docs, tickets, runbooks, and product data with sources and permissions.
Useful when people spend too long searching or get different answers from different systems.
Enterprise searchRAGPermissions
Read more
Automate internal workflows
Use AI to route work, draft outputs, trigger actions, and keep approvals and logs in place.
Useful when repetitive work moves across multiple tools and teams.
AI agentsWorkflow automationGovernance
Read more
Add AI to products and internal tools
Build assistants, guided actions, or decision support into the software your team or customers already use.
Useful when AI needs to be part of the product, not a separate tool.
AI integrationDecision supportModel routing
Read moreAI FINANCIAL REPORTING IMPLEMENTATION
Frequently Asked Questions
Practical questions from finance leaders and architects planning AI-driven narrative reporting for QuickBooks.
The integration uses QuickBooks' official Reporting API and Data Service via OAuth 2.0. A typical secure architecture involves:
- Authentication & Scoping: The AI system authenticates using a service account with the minimum required scopes (e.g.,
com.intuit.quickbooks.accounting). Permissions are scoped toReadonly for reporting endpoints. - Data Flow: The AI agent or workflow sends a structured query (e.g., "get Profit and Loss for Q1 2024 with department detail") to a middleware layer.
- API Call: The middleware calls the QuickBooks API, such as the
ProfitAndLossorBalanceSheetendpoints, often with parameters forstart_date,end_date, andcolumns. - Context Building: The raw JSON/XML report data is combined with metadata (previous period data, budget figures uploaded via the
AttachableAPI) to form a context payload for the LLM. - Zero Data Persistence (Optional): For high-security deployments, the middleware can be configured to not persist QuickBooks data, acting as a stateless proxy. All reporting context is held in memory for the duration of the LLM call.
This approach ensures access is auditable via QuickBooks' Audit Log and adheres to the principle of least privilege.

About the author
Prasad Kumkar
CEO & MD, Inference Systems
Prasad Kumkar is the CEO & MD of Inference Systems and writes about AI systems architecture, LLM infrastructure, model serving, evaluation, and production deployment. Over 5+ years, he has worked across computer vision models, L5 autonomous vehicle systems, and LLM research, with a focus on taking complex AI ideas into real-world engineering systems.
His work and writing cover AI systems, large language models, AI agents, multimodal systems, autonomous systems, inference optimization, RAG, evaluation, and production AI engineering.
LinkedIn
Limited slotsGet a Free AI Consultation
Partnered with leading AI, data, and software stack.


How We Work
Custom AI workflows for your Business
One-fit-all AI don't work for modern businesses. At Inferensys, we aim to understand your business & custom requirements; which we use to define most efficient agentic workflows, the data, and the tools for your business.
01
Review the use case
We understand the task, the users, and where AI can actually help.
Read more02
Pick the right approach
We define what needs search, automation, or product integration.
Read more03
Build the first useful version
We implement the part that proves the value first.
Read more04
Improve from there
We add the checks and visibility needed to keep it useful.
Read moreThe first call is a practical review of your use case and the right next step.
Talk to Us