Mean Time Between Failure (MTBF) is a statistical metric representing the predicted elapsed time between inherent failures of a repairable mechanical or electronic system during normal operation. It is calculated by dividing the total operational uptime by the number of failures observed, providing a baseline for asset availability and maintenance planning.

Glossary
Mean Time Between Failure (MTBF)
Mean Time Between Failure (MTBF) is a reliability metric representing the predicted elapsed time between inherent failures of a repairable mechanical or electronic system during normal operation.
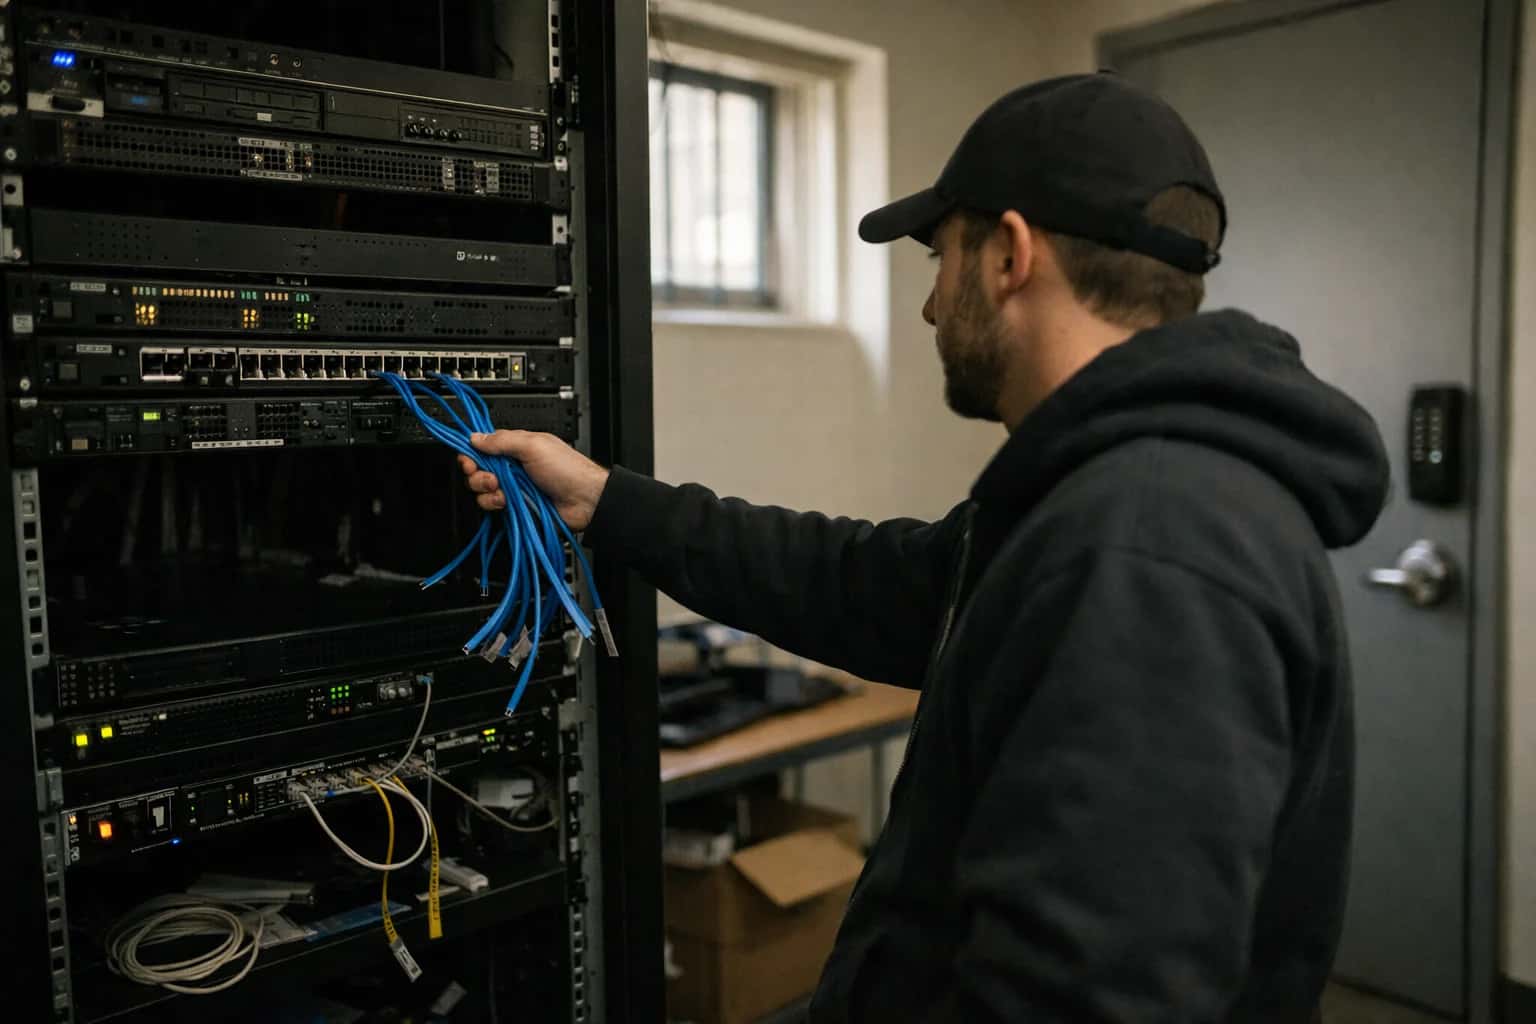
RELIABILITY ENGINEERING
What is Mean Time Between Failure (MTBF)?
Mean Time Between Failure (MTBF) is a fundamental reliability metric used to predict the average operational time between repairable system failures.
MTBF is distinct from Mean Time To Failure (MTTF) , which applies to non-repairable assets. In modern Software-Defined Manufacturing Automation, MTBF data feeds into Predictive Maintenance Algorithms to forecast Remaining Useful Life (RUL) and optimize Condition-Based Maintenance (CBM) schedules, moving beyond reactive repairs.
RELIABILITY METRICS COMPARISON
MTBF vs. MTTF vs. MTTR: Key Differences
A comparative analysis of the three core metrics used to quantify system reliability, failure characteristics, and maintainability in industrial and manufacturing environments.
| Metric | Mean Time Between Failure (MTBF) | Mean Time To Failure (MTTF) | Mean Time To Repair (MTTR) |
|---|---|---|---|
Primary Definition | Predicted elapsed time between inherent failures of a repairable system during normal operation. | Predicted elapsed time before the first failure of a non-repairable system or component. | Average time required to diagnose a failed system, perform the repair, and restore full operational functionality. |
System Type | Repairable systems only | Non-repairable or replaceable assets | Repairable systems only |
Core Focus | Reliability and failure frequency | Inherent asset lifespan | Maintainability and serviceability |
Calculation Formula | Total operational time / Number of failures | Total operational time across identical units / Number of units tested | Total repair downtime / Number of repair events |
Includes Repair Time | |||
Includes Operational Time | |||
Typical Unit of Measure | Hours, days, or cycles | Hours, days, or cycles | Hours or minutes |
Primary Use Case | Scheduling preventive maintenance intervals and calculating Overall Equipment Effectiveness (OEE). | Selecting components with specified lifespans and planning replacement inventory. | Optimizing technician response workflows and setting service-level agreements (SLAs). |
RELIABILITY ENGINEERING
Core Characteristics of MTBF
Mean Time Between Failure (MTBF) is a foundational reliability metric for repairable systems. The following cards break down its critical attributes, calculation, and limitations in the context of modern predictive maintenance.
01
Definition and Core Formula
MTBF represents the predicted elapsed time between inherent failures of a repairable system during normal operation. It is calculated by dividing the total operational uptime by the number of failures.
- Formula: MTBF = Total Uptime / Number of Failures
- Unit: Typically expressed in hours (e.g., 50,000 hours).
- Scope: Applies only to repairable items; for non-repairable items, the equivalent metric is Mean Time To Failure (MTTF).
- Statistical Nature: It is an arithmetic mean, meaning a single catastrophic failure can drastically skew the average if the sample size is small.
Uptime / Failures
Core Formula
02
The 'Bathtub Curve' Assumption
Classic MTBF analysis assumes a constant failure rate during the asset's useful life period, visualized by the flat bottom of the bathtub curve.
- Infant Mortality: Early failures due to manufacturing defects are excluded from standard MTBF calculations.
- Useful Life: The period where random, constant-rate failures occur. MTBF is only statistically valid here.
- Wear-Out Phase: At the end of life, the failure rate increases exponentially. MTBF becomes irrelevant as the constant-rate assumption breaks down.
- Modern Context: In predictive maintenance, we specifically target the wear-out phase to forecast Remaining Useful Life (RUL), moving beyond the static MTBF average.
03
MTBF vs. MTTR: Operational Availability
MTBF is meaningless in isolation. It must be paired with Mean Time To Repair (MTTR) to calculate Operational Availability (Ao).
- Availability Formula: Ao = MTBF / (MTBF + MTTR)
- High MTBF, High MTTR: A system that rarely fails but takes weeks to fix still has poor availability.
- Low MTBF, Low MTTR: A system that fails daily but restarts in seconds can have high availability.
- Goal: The objective is not just to maximize MTBF, but to optimize the ratio by minimizing repair time through rapid diagnostics and modular part replacement.
Ao = MTBF / (MTBF + MTTR)
Availability Equation
04
Limitations in Predictive Maintenance
Relying solely on MTBF for maintenance scheduling is a reactive strategy that leads to unnecessary swaps or unexpected downtime.
- Ignores Actual Condition: MTBF is a population statistic. It doesn't account for the specific load, environment, or degradation state of an individual machine.
- No Degradation Insight: It provides a binary state (working/failed) rather than a continuous Health Index.
- Censored Data Blindness: MTBF calculations often ignore assets that haven't failed yet, biasing the metric.
- Modern Alternative: Predictive models focus on Remaining Useful Life (RUL), which dynamically updates based on real-time sensor fusion (vibration, temperature) rather than a static historical average.
05
Data Requirements for Accurate Calculation
Calculating a statistically significant MTBF requires rigorous data hygiene and sufficient sample size.
- Run-to-Failure Data: You need complete historical logs from the start of operation to the breakdown point.
- Censored Data Handling: You must account for units that are still operational. Using only failed units inflates the failure rate.
- Failure Definition: A clear taxonomy is required. Is a 1-second power glitch a failure? Failure Mode Classification must be standardized.
- Operational Context: The MTBF of a motor in a clean room differs drastically from one in a foundry. Contextual metadata is critical for accurate segmentation.
06
Integration with Digital Twins
Digital Twin technology transforms MTBF from a static historical report into a dynamic simulation parameter.
- Virtual Stress Testing: Engineers can simulate increased loads on a digital replica to see how it impacts the predicted MTBF without risking physical hardware.
- Synthetic Data Generation: Digital twins can generate synthetic failure data for rare events, filling gaps in the historical MTBF calculation.
- Real-Time Updates: As the physical asset degrades, the digital twin can adjust the expected failure probability, effectively creating a dynamic, condition-based MTBF that reflects the current Degradation Modeling state.
RELIABILITY ENGINEERING
Frequently Asked Questions
Clear, technically precise answers to the most common questions about Mean Time Between Failure (MTBF) and its role in predictive maintenance and industrial reliability.
Mean Time Between Failure (MTBF) is a reliability metric representing the predicted elapsed time between inherent failures of a repairable system during normal operation. It is calculated by dividing the total operational uptime by the number of failures observed during that period: MTBF = Total Uptime / Number of Failures. For example, if three identical pumps operate for a combined 10,000 hours and experience 4 failures, the MTBF is 2,500 hours. This calculation assumes a constant failure rate during the useful life phase of the bathtub curve, where failures occur randomly rather than from infant mortality or wear-out mechanisms. The metric is expressed in hours and serves as a foundational input for reliability block diagrams, spare parts inventory planning, and maintenance scheduling.
Enabling Efficiency, Speed & Accuracy
Intelligent Analysis, Decision & Execution
We build AI systems for teams that need search across company data, workflow automation across tools, or AI features inside products and internal software.
Talk to Us
Search across company data
Give teams answers from docs, tickets, runbooks, and product data with sources and permissions.
Useful when people spend too long searching or get different answers from different systems.
Enterprise searchRAGPermissions
Read more
Automate internal workflows
Use AI to route work, draft outputs, trigger actions, and keep approvals and logs in place.
Useful when repetitive work moves across multiple tools and teams.
AI agentsWorkflow automationGovernance
Read more
Add AI to products and internal tools
Build assistants, guided actions, or decision support into the software your team or customers already use.
Useful when AI needs to be part of the product, not a separate tool.
AI integrationDecision supportModel routing
Read more
About the author
Prasad Kumkar
CEO & MD, Inference Systems
Prasad Kumkar is the CEO & MD of Inference Systems and writes about AI systems architecture, LLM infrastructure, model serving, evaluation, and production deployment. Over 5+ years, he has worked across computer vision models, L5 autonomous vehicle systems, and LLM research, with a focus on taking complex AI ideas into real-world engineering systems.
His work and writing cover AI systems, large language models, AI agents, multimodal systems, autonomous systems, inference optimization, RAG, evaluation, and production AI engineering.
LinkedIn
Limited slotsGet a Free AI Consultation
Partnered with leading AI, data, and software stack.





How We Work
Custom AI workflows for your Business
One-fit-all AI don't work for modern businesses. At Inferensys, we aim to understand your business & custom requirements; which we use to define most efficient agentic workflows, the data, and the tools for your business.
01
Review the use case
We understand the task, the users, and where AI can actually help.
Read more02
Pick the right approach
We define what needs search, automation, or product integration.
Read more03
Build the first useful version
We implement the part that proves the value first.
Read more04
Improve from there
We add the checks and visibility needed to keep it useful.
Read moreThe first call is a practical review of your use case and the right next step.
Talk to Us