A performance benchmark is a standardized test or suite of tests designed to provide a quantitative, reproducible measure of a system's operational characteristics. In machine learning and agentic systems, this typically measures latency, throughput, resource utilization (CPU/GPU/memory), and accuracy against a golden dataset. It establishes a baseline for comparison during A/B testing, canary deployments, or after architectural changes, forming the core of evaluation-driven development. Benchmarks are critical for validating that inference optimization or model compression techniques achieve their intended gains.
Glossary
Performance Benchmark
A performance benchmark is a standardized test or set of tests used to measure and compare the speed, throughput, or resource utilization of a system or component.
VERIFICATION AND VALIDATION
What is a Performance Benchmark?
A standardized test suite used to quantitatively measure and compare the speed, throughput, or resource efficiency of a system or component.
Effective benchmarks are integrated into continuous integration/continuous deployment (CI/CD) pipelines and verification and validation workflows to catch regressions. For autonomous agents, benchmarks extend beyond raw speed to measure the quality of tool calling, the efficiency of retrieval-augmented generation queries, or the success rate of corrective action planning in recursive error correction loops. They provide the empirical data needed for dynamic analysis, load testing, and ensuring fault-tolerant agent design meets service-level agreements (SLAs) in production.
VERIFICATION AND VALIDATION PIPELINES
Key Performance Metrics in AI/ML
A performance benchmark is a standardized test or set of tests used to measure and compare the speed, throughput, or resource utilization of a system or component. These metrics are foundational for evaluating the efficacy of AI agents and models within verification and validation pipelines.
01
Latency & Throughput
Latency measures the time delay between an input being submitted and the corresponding output being generated, critical for real-time applications. Throughput quantifies the number of tasks or inferences a system can process per unit of time (e.g., queries per second).
- Real-time Example: An autonomous agent performing fraud detection must have sub-second latency to block transactions.
- Batch Processing: High throughput is prioritized for offline data processing jobs, where total completion time matters more than individual response time.
- Measurement: Typically reported in milliseconds (p50, p95, p99 latencies) and inferences per second (IPS).
< 1 sec
Target Real-Time Latency
10k+
QPS for High-Throughput Systems
02
Model Accuracy Metrics
These metrics evaluate the predictive correctness of a machine learning model against a ground truth dataset.
- Precision & Recall: For classification, precision measures the correctness of positive predictions, while recall measures the model's ability to find all relevant instances. The F1 Score provides their harmonic mean.
- ROC-AUC: The Area Under the Receiver Operating Characteristic Curve evaluates a model's ability to discriminate between classes across all thresholds.
- Mean Absolute Error (MAE) & Root Mean Squared Error (RMSE): Standard metrics for regression tasks, quantifying the average magnitude of prediction errors.
03
Resource Utilization & Efficiency
Benchmarks for computational cost and hardware efficiency, directly tied to infrastructure spending and scalability.
- FLOPs (Floating Point Operations): Counts the number of floating-point calculations required for a single inference, indicating theoretical computational cost.
- Memory Footprint: Measures peak RAM/VRAM consumption during model loading and inference.
- Energy Consumption: Increasingly critical for edge AI and sustainable computing, measured in joules per inference.
- Cost-Per-Inference: A business-centric metric combining compute time, memory, and cloud instance costs.
99.9%
Target GPU Utilization
04
Robustness & Reliability Metrics
Metrics that assess system stability under stress, faulty inputs, or changing conditions, essential for fault-tolerant agent design.
- Uptime & Availability: Percentage of time the system is operational and responding (e.g., 99.95%).
- Error Rate: The frequency of failed requests or incorrect outputs.
- Performance Under Load: Measures latency and throughput degradation as concurrent request volume increases, identified via load testing and stress testing.
- Recovery Time Objective (RTO): The target time for a system to recover from a failure, relevant for self-healing software systems.
05
Business & Operational KPIs
Higher-level metrics that connect technical performance to business outcomes and operational health.
- Conversion Rate / Task Success Rate: For agents driving user actions, this measures the percentage of interactions that achieve the desired goal.
- Mean Time Between Failures (MTBF): The average operational time between system outages or critical errors.
- Mean Time To Resolution (MTTR): The average time to diagnose and recover from a failure, improved by automated root cause analysis.
- User Satisfaction (CSAT) / Net Promoter Score (NPS): Direct feedback metrics that often correlate with latency and accuracy.
COMPARISON
Types of Performance Benchmarks
A comparison of common benchmark methodologies used to evaluate system performance, speed, and resource utilization.
| Benchmark Type | Synthetic Benchmark | Application Benchmark | Microbenchmark | Cross-Platform Benchmark |
|---|---|---|---|---|
Primary Objective | Measure theoretical peak performance of a specific component (e.g., GPU FLOPs) | Measure end-to-end performance of a real-world application or workload | Measure the performance of a very small, isolated code operation | Compare performance of the same workload across different hardware/software stacks |
Representativeness of Real Use | ||||
Execution Complexity | Low | High | Very Low | Medium to High |
Result Granularity | Aggregate score (e.g., points, ops/sec) | End-user metrics (e.g., frames/sec, query latency) | Nanosecond/microsecond timings | Relative performance scores or ratios |
Common Tools/Examples | SPEC CPU, MLPerf Inference (closed division) | Video game frame rate tests, database transaction benchmarks | Google Benchmark, Java Microbenchmark Harness | Geekbench, CrossMark |
Primary Use Case | Hardware comparison and marketing | System selection and capacity planning | Low-level code optimization | Architectural decision-making and portability assessment |
Ease of Interpretation | Medium (requires domain knowledge) | High (directly relates to user experience) | High (for developers) | High (for cross-stack comparison) |
Sensitivity to System Configuration | High | Very High | Low | Very High |
STANDARDIZED METRICS
Common AI/ML Performance Benchmarks
Performance benchmarks are standardized tests that measure and compare the speed, accuracy, and resource efficiency of AI/ML systems, providing objective data for engineering decisions.
01
Inference Latency & Throughput
Measures the time to process a single input (latency) and the number of inputs processed per second (throughput). Critical for real-time applications.
- Key Metrics: P50/P95/P99 latency (milliseconds), queries per second (QPS), tokens per second.
- Tools: MLPerf Inference, custom load-testing harnesses.
- Example: A vision model must achieve <100ms P99 latency for autonomous vehicle perception.
02
Model Accuracy & Quality
Quantifies the correctness of a model's predictions against a golden dataset or ground truth. Varies by task type.
- Classification: Accuracy, Precision, Recall, F1 Score, ROC-AUC.
- Generation: BLEU, ROUGE, METEOR (for text); Fréchet Inception Distance (for images).
- Regression: Mean Absolute Error (MAE), Root Mean Squared Error (RMSE).
03
Resource Utilization
Benchmarks the computational cost of running a model, directly impacting infrastructure expenses and deployment feasibility.
- Compute: FLOPs (Floating Point Operations), GPU/CPU utilization.
- Memory: Peak VRAM/RAM consumption during inference.
- Power: Watts consumed per inference, crucial for edge AI and tiny ML deployments.
04
Robustness & Fairness
Evaluates model performance under stress, adversarial conditions, and across diverse subgroups to ensure reliability and equity.
- Robustness: Performance under data drift, concept drift, or noisy inputs.
- Fairness: Disparity in accuracy (recall, F1 score) across protected attributes (e.g., gender, ethnicity).
- Tools: AI Fairness 360, Robustness Metrics in MLPerf.
05
Training Efficiency
Measures the speed and cost of the model development cycle, from data to a trained model. Vital for research and iterative evaluation-driven development.
- Key Metrics: Time-to-accuracy (hours/days to reach target accuracy), training FLOPs.
- Frameworks: MLPerf Training is the industry-standard benchmark suite.
- Context: Directly informs decisions about parameter-efficient fine-tuning vs. full training.
06
System-Level & End-to-End
Benchmarks the entire application pipeline, not just the isolated model. Includes data fetching, pre/post-processing, and network latency.
- Scope: Measures total user-observed latency and system throughput.
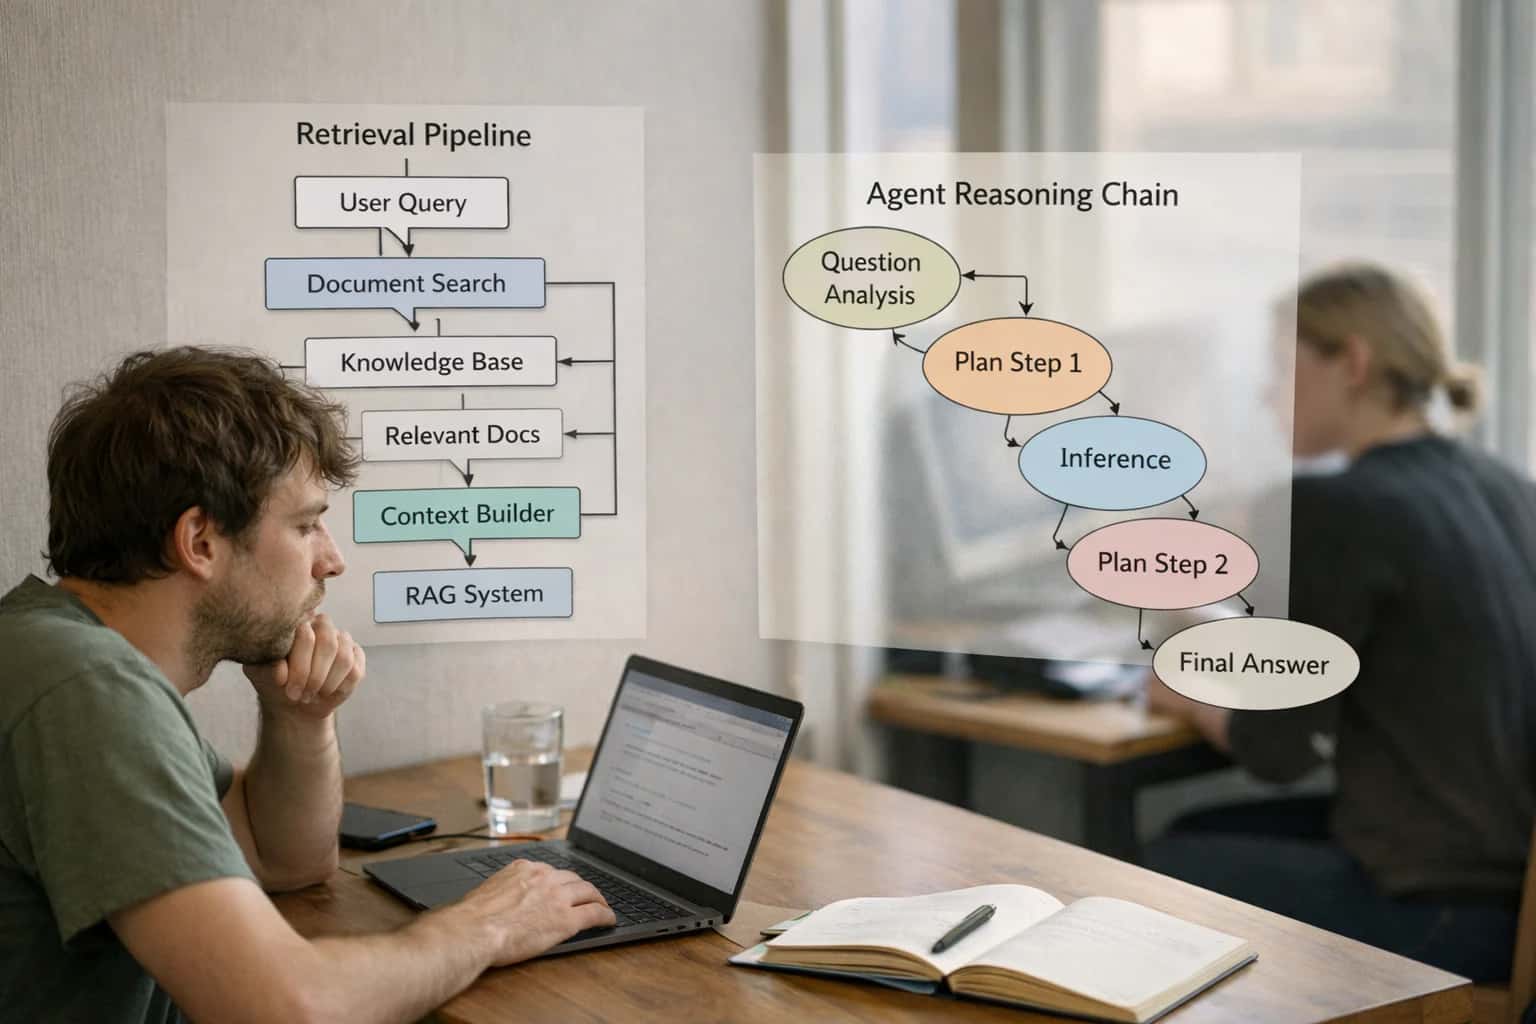
- Use Case: Essential for agentic systems involving tool calling, retrieval-augmented generation, and multi-step reasoning.
- Method: Often requires custom integration tests and load tests simulating production traffic.
PERFORMANCE BENCHMARK
Frequently Asked Questions
A performance benchmark is a standardized test or set of tests used to measure and compare the speed, throughput, or resource utilization of a system or component. These FAQs address its role in verification and validation pipelines for autonomous agents.
A performance benchmark is a standardized test or set of tests used to measure and compare the speed, throughput, or resource utilization of a system or component against a defined baseline or competing systems. In the context of verification and validation pipelines for autonomous agents, it provides quantitative, repeatable metrics to assess whether an agent meets latency, cost, and scalability requirements before deployment. Benchmarks move evaluation beyond functional correctness to include critical operational characteristics like inference latency, token throughput, and memory footprint, ensuring the system is viable for production environments.
Enabling Efficiency, Speed & Accuracy
Intelligent Analysis, Decision & Execution
We build AI systems for teams that need search across company data, workflow automation across tools, or AI features inside products and internal software.
Talk to Us
Search across company data
Give teams answers from docs, tickets, runbooks, and product data with sources and permissions.
Useful when people spend too long searching or get different answers from different systems.
Enterprise searchRAGPermissions
Read more
Automate internal workflows
Use AI to route work, draft outputs, trigger actions, and keep approvals and logs in place.
Useful when repetitive work moves across multiple tools and teams.
AI agentsWorkflow automationGovernance
Read more
Add AI to products and internal tools
Build assistants, guided actions, or decision support into the software your team or customers already use.
Useful when AI needs to be part of the product, not a separate tool.
AI integrationDecision supportModel routing
Read more
About the author
Prasad Kumkar
CEO & MD, Inference Systems
Prasad Kumkar is the CEO & MD of Inference Systems and writes about AI systems architecture, LLM infrastructure, model serving, evaluation, and production deployment. Over 5+ years, he has worked across computer vision models, L5 autonomous vehicle systems, and LLM research, with a focus on taking complex AI ideas into real-world engineering systems.
His work and writing cover AI systems, large language models, AI agents, multimodal systems, autonomous systems, inference optimization, RAG, evaluation, and production AI engineering.
LinkedIn
Limited slotsGet a Free AI Consultation
Partnered with leading AI, data, and software stack.


How We Work
Custom AI workflows for your Business
One-fit-all AI don't work for modern businesses. At Inferensys, we aim to understand your business & custom requirements; which we use to define most efficient agentic workflows, the data, and the tools for your business.
01
Review the use case
We understand the task, the users, and where AI can actually help.
Read more02
Pick the right approach
We define what needs search, automation, or product integration.
Read more03
Build the first useful version
We implement the part that proves the value first.
Read more04
Improve from there
We add the checks and visibility needed to keep it useful.
Read moreThe first call is a practical review of your use case and the right next step.
Talk to Us