An execution trace is a chronological, granular log of all instructions, function calls, state changes, and external interactions performed by a system—such as an autonomous agent or software process—during a specific run. It serves as a complete audit trail, capturing the decision logic, tool calls, data transformations, and branching paths taken from start to finish. This record is essential for observability, enabling engineers to reconstruct the exact sequence of events that produced any given output or error.
Glossary
Execution Trace
An execution trace is a chronological log or record of all instructions, function calls, state changes, and external interactions performed by a system during a specific run.
AUTOMATED ROOT CAUSE ANALYSIS
What is an Execution Trace?
An execution trace is a foundational data structure for debugging and analyzing the behavior of autonomous systems.
In automated root cause analysis, the execution trace is the primary artifact for fault localization and error propagation analysis. By examining the trace, algorithms can perform traceback analysis to pinpoint the precise step where a deviation occurred, whether due to faulty logic, incorrect data, or an unexpected API response. This capability is critical for building self-healing software systems and implementing recursive error correction loops, where agents use their own traces to diagnose and correct failures autonomously.
ANATOMY OF A TRACE
Key Components of an Execution Trace
An execution trace is a structured, chronological log. For automated root cause analysis, it must capture specific, actionable data points that allow algorithms to pinpoint the exact origin of a failure.
01
Sequential Step Log
The core chronological record of all actions taken. Each entry typically includes:
- Timestamp: Precise time of execution.
- Step ID/Index: A unique identifier for ordering.
- Action Type: Classification (e.g., 'Reasoning', 'Tool Call', 'Decision Point').
- Input/Context: The data or state upon which the step acted.
- Output/Result: The generated data or state change. This linear sequence is the primary data structure for reconstructing the agent's path and identifying where outputs diverged from expectations.
02
Internal State Snapshots
Checkpoints of the agent's volatile memory and reasoning context at key moments. This is critical for understanding why a decision was made. Components include:
- Working Memory: The short-term data actively being processed.
- Goal Stack: The current and pending objectives.
- Belief State: The agent's assumptions about the world.
- Confidence Scores: Probabilistic measures attached to intermediate conclusions. Without state snapshots, an RCA algorithm sees only actions, not the internal logic that drove them.
03
Tool Call & External Interaction Records
A detailed log of all interactions with external systems, which are common failure points. Each record must capture:
- API Endpoint or Function: The specific external resource invoked.
- Arguments Sent: The exact parameters or payload.
- Response Received: The raw output, including any error codes or timeouts.
- Latency: Duration of the call. This allows RCA to distinguish between an internal logic error and a failure caused by an unreliable external service or malformed query.
04
Decision Points & Branching Logic
Explicit markers where the agent's execution path was determined by a conditional rule, a learned policy, or an LLM-generated choice. For analysis, traces log:
- Condition Evaluated: The logical expression or criteria.
- Options Considered: The potential branches (if available).
- Chosen Path: The selected option.
- Selection Rationale: The reason for the choice, often extracted from an LLM's chain-of-thought. This enables blame assignment to specific flawed decision rules or misleading contextual data.
05
Error Events & Exception Handlers
Structured records of failures encountered during execution, which are often the starting point for RCA. A comprehensive trace logs:
- Error Type: Classification (e.g.,
ToolExecutionError,ValidationError,LogicError). - Error Message & Code: The precise technical descriptor.
- Stack Trace: The call path within the agent's framework.
- Handler Triggered: Which mitigation or rollback routine was executed.
- Post-Error State: The system state after the exception was handled. This transforms a generic failure into a queryable event for pattern analysis.
06
Metadata & Correlation IDs
Contextual data that links the trace to the broader system, enabling cross-trace analysis and aggregation. Essential metadata includes:
- Session/Trace ID: A unique identifier for the entire execution run.
- Parent/Child Relationships: Links to traces of sub-agents or spawned processes.
- User/Request ID: The origin of the triggering event.
- Agent Version & Configuration: The specific code and prompt set used.
- Environmental Tags: Deployment stage, region, or hardware profile. This metadata is crucial for failure diagnosis across a population of agents, identifying systemic issues versus one-off anomalies.
FOUNDATIONAL CONCEPT
The Role of Execution Traces in Automated Root Cause Analysis
In automated root cause analysis, an execution trace serves as the definitive forensic record, enabling algorithms to systematically reconstruct and analyze the precise sequence of events that led to a failure.
An execution trace is a chronological, granular log of all instructions, function calls, state changes, and external interactions performed by a system during a specific run. In the context of automated root cause analysis (RCA), this trace provides the essential data backbone. Algorithms parse this structured timeline to perform fault localization and blame assignment, moving beyond symptoms to identify the exact decision, data point, or tool call where the error originated.
The trace enables causal chain analysis by mapping error propagation through the system's components. For autonomous agents, this is critical for recursive error correction, as the trace allows the agent or an overseer to rollback to a known-good state and adjust the execution path. This transforms debugging from a manual investigation into a deterministic, algorithmic process of traceback analysis, directly supporting the engineering of self-healing software systems.
DIAGNOSTIC DATA TYPES
Execution Trace vs. System Log: A Critical Distinction
This table compares the fundamental characteristics of an Execution Trace and a traditional System Log, highlighting their distinct roles in automated root cause analysis.
| Feature | Execution Trace | System Log |
|---|---|---|
Primary Purpose | Reconstruct the precise, causal sequence of an agent's internal reasoning, decisions, and state changes. | Record system-level events, errors, and operational status for monitoring and auditing. |
Granularity | Step-by-step, often at the level of individual function calls, tool invocations, and LLM reasoning steps. | Event-based, capturing discrete occurrences like API calls, errors, or state transitions. |
Causal Structure | Explicitly models cause-and-effect relationships between steps; essential for tracing error propagation. | Chronological but not inherently causal; events are logged as they occur without linking them logically. |
Content Focus | Internal agent cognition: prompts, intermediate thoughts, decision rationales, tool inputs/outputs, and state mutations. | External system behavior: resource usage, network requests, user authentication, and application errors. |
Format & Schema | Structured, domain-specific schema (e.g., OpenTelemetry spans, MCP tool calls) designed for programmatic analysis. | Often semi-structured text (e.g., JSON logs, syslog) with varying schemas, optimized for human readability and grep. |
Use in Automated RCA | Directly enables fault localization, blame assignment, and causal chain analysis by providing the agent's internal "filmstrip." | Provides contextual clues and timestamps but requires significant inference to reconstruct the agent's internal failure path. |
Temporal Scope | Bounded to a single execution run or task of an autonomous agent. | Continuous, covering the entire operational lifetime of a system or service. |
Primary Consumer | Automated debugging systems, root cause analysis algorithms, and agentic observability platforms. | Human operators (SREs, DevOps), monitoring dashboards, and alerting systems. |
EXECUTION TRACE
Common Implementation Contexts
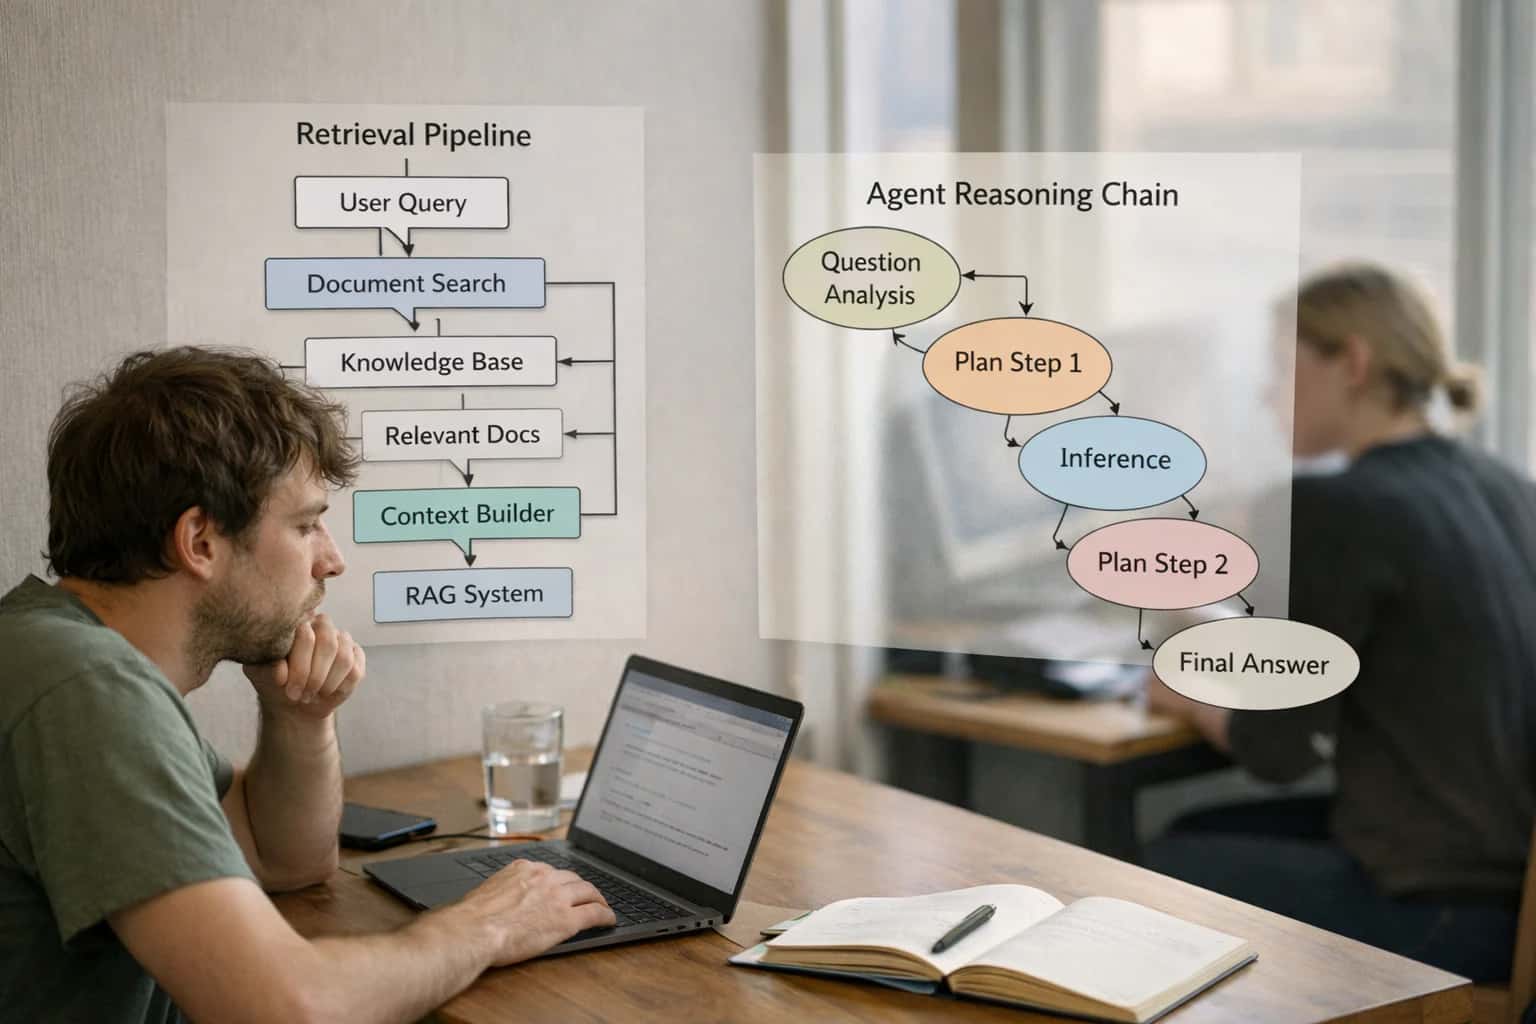
An execution trace is a foundational data structure for observability and debugging. Its utility is realized in specific technical contexts where granular, chronological insight into system behavior is paramount.
EXECUTION TRACE
Frequently Asked Questions
An execution trace is a chronological log or record of all the instructions, function calls, state changes, and external interactions performed by a system during a specific run. These questions address its role in automated root cause analysis for autonomous agents.
An execution trace is a chronological, granular log that records every step a system—such as an autonomous agent, a software process, or a machine learning model—takes during a specific run. It captures a sequence of low-level events including function calls, internal state changes, decision logic, tool invocations (API calls), data inputs/outputs, and external interactions. In the context of agentic systems and recursive error correction, the trace serves as the foundational forensic dataset for automated root cause analysis, enabling algorithms to replay and dissect the exact pathway that led to an error or unexpected output. Unlike simple logs, a comprehensive execution trace is structured to preserve causal links between steps, making it possible to perform dependency analysis and error propagation studies.
Enabling Efficiency, Speed & Accuracy
Intelligent Analysis, Decision & Execution
We build AI systems for teams that need search across company data, workflow automation across tools, or AI features inside products and internal software.
Talk to Us
Search across company data
Give teams answers from docs, tickets, runbooks, and product data with sources and permissions.
Useful when people spend too long searching or get different answers from different systems.
Enterprise searchRAGPermissions
Read more
Automate internal workflows
Use AI to route work, draft outputs, trigger actions, and keep approvals and logs in place.
Useful when repetitive work moves across multiple tools and teams.
AI agentsWorkflow automationGovernance
Read more
Add AI to products and internal tools
Build assistants, guided actions, or decision support into the software your team or customers already use.
Useful when AI needs to be part of the product, not a separate tool.
AI integrationDecision supportModel routing
Read more
About the author
Prasad Kumkar
CEO & MD, Inference Systems
Prasad Kumkar is the CEO & MD of Inference Systems and writes about AI systems architecture, LLM infrastructure, model serving, evaluation, and production deployment. Over 5+ years, he has worked across computer vision models, L5 autonomous vehicle systems, and LLM research, with a focus on taking complex AI ideas into real-world engineering systems.
His work and writing cover AI systems, large language models, AI agents, multimodal systems, autonomous systems, inference optimization, RAG, evaluation, and production AI engineering.
LinkedIn
Limited slotsGet a Free AI Consultation
Partnered with leading AI, data, and software stack.


How We Work
Custom AI workflows for your Business
One-fit-all AI don't work for modern businesses. At Inferensys, we aim to understand your business & custom requirements; which we use to define most efficient agentic workflows, the data, and the tools for your business.
01
Review the use case
We understand the task, the users, and where AI can actually help.
Read more02
Pick the right approach
We define what needs search, automation, or product integration.
Read more03
Build the first useful version
We implement the part that proves the value first.
Read more04
Improve from there
We add the checks and visibility needed to keep it useful.
Read moreThe first call is a practical review of your use case and the right next step.
Talk to Us