Anomaly attribution is the algorithmic process of assigning responsibility for a detected statistical deviation or system failure to specific input features, internal model states, or execution steps. It moves beyond simple detection by answering why an anomaly occurred, identifying the precise contributing factors—such as a corrupted data point, a specific feature's aberrant value, or a faulty logic path—that led to the irregular output. This is foundational for automated root cause analysis in autonomous systems.
Glossary
Anomaly Attribution
Anomaly attribution is the process of assigning responsibility for a detected deviation from normal system behavior to specific features, inputs, or internal states.
AUTOMATED ROOT CAUSE ANALYSIS
What is Anomaly Attribution?
Anomaly attribution is a core technique in automated root cause analysis, enabling systems to not just detect but also explain deviations.
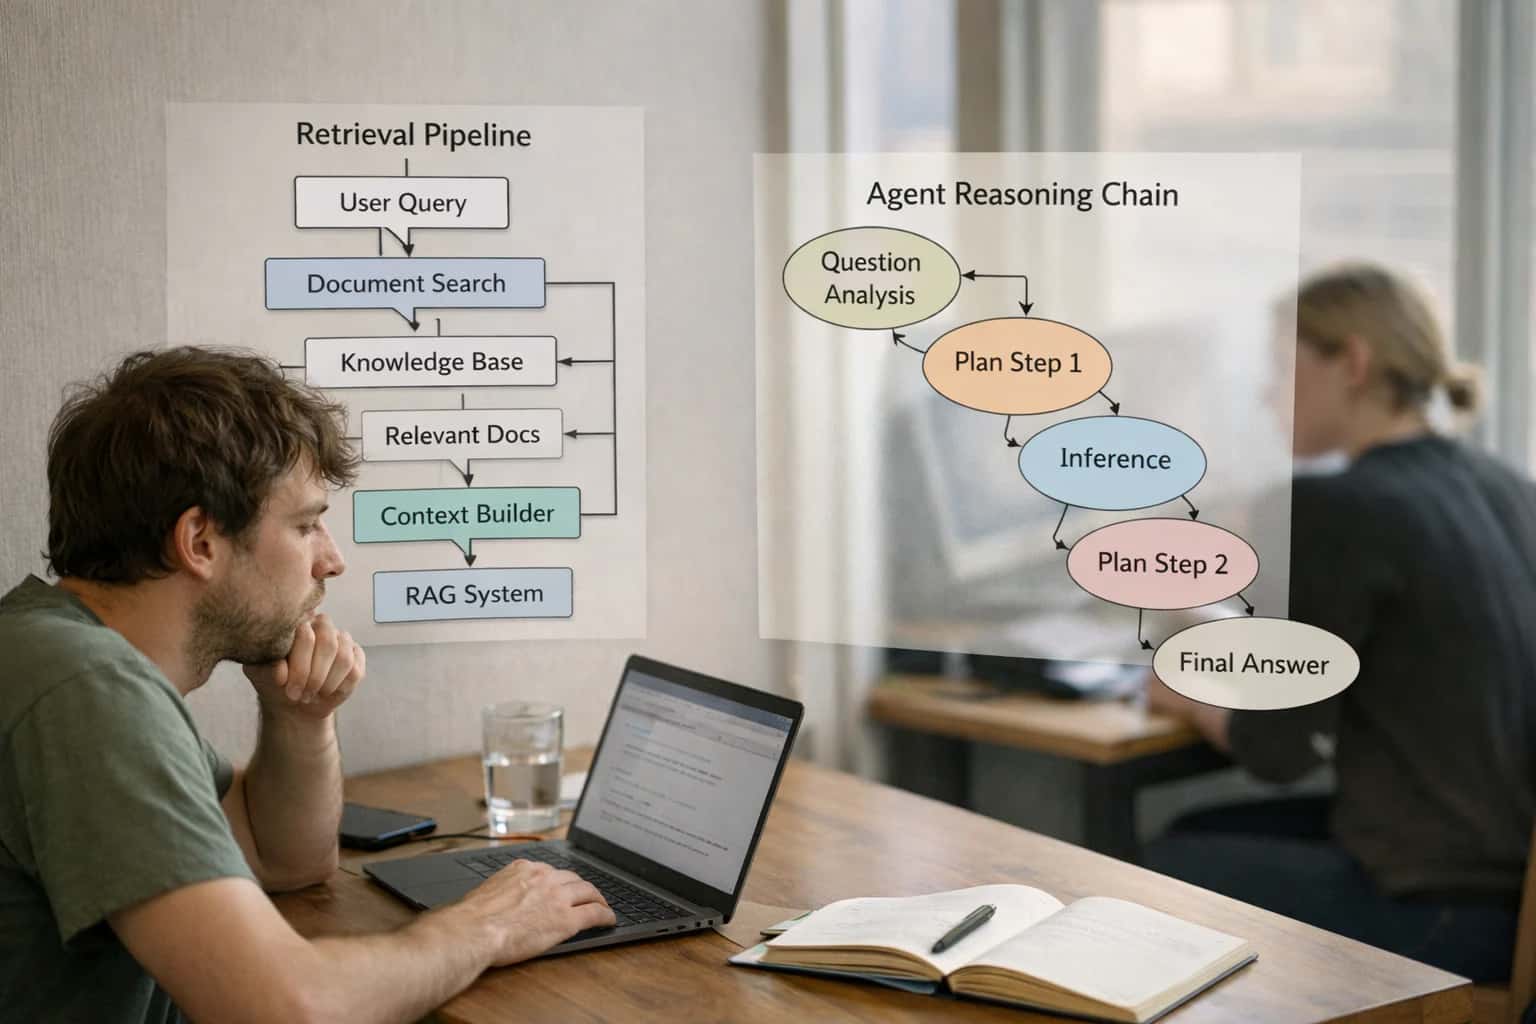
The process typically employs techniques like Shapley values, integrated gradients, or attention mechanisms to decompose an anomalous prediction or system state. In agentic systems and recursive error correction, this allows the agent to understand which part of its reasoning chain or which piece of retrieved context was faulty. Effective attribution provides actionable insights for corrective action planning and is critical for building self-healing software that can autonomously diagnose and rectify its own failures.
AUTOMATED ROOT CAUSE ANALYSIS
Key Features of Anomaly Attribution
Anomaly attribution is the process of assigning responsibility for a detected deviation from normal system behavior to specific features, inputs, or internal states. The following features define its technical implementation and value.
01
Feature Attribution & Shapley Values
Anomaly attribution often employs Shapley values from cooperative game theory to quantify each feature's marginal contribution to the deviation. This method provides a mathematically fair distribution of "blame" across all inputs by evaluating the model's output with and without each feature. For example, in a fraud detection model, Shapley values can reveal that a transaction's geolocation mismatch contributed 60% to its anomaly score, while the time-of-day contributed 25%.
- Key Benefit: Provides an additive, consistent measure of feature importance.
- Computational Note: Exact calculation is NP-hard, requiring approximations like KernelSHAP or TreeSHAP for practical use in production systems.
02
Causal Inference over Correlation
Advanced attribution moves beyond identifying correlated features to inferring causal pathways. Using causal graphs or structural causal models, the system distinguishes whether a feature change caused the anomaly or is merely associated with it. For instance, in server latency spikes, attribution might identify that a specific microservice's failure (cause) led to increased database connection pools (correlated effect), not vice-versa.
- Key Technique: Utilizes do-calculus or counterfactual reasoning to estimate the effect of an intervention.
- Enterprise Impact: Enables targeted remediation (fix the root cause) instead of symptomatic treatment.
03
Multi-Granular Localization
Attribution operates at multiple levels of system abstraction to pinpoint responsibility precisely.
- Infrastructure Level: Attributes anomaly to a specific host, container, or cloud region.
- Service/Application Level: Isolates the faulty microservice, API endpoint, or function.
- Code/Execution Level: Identifies the specific function, database query, or even code line causing the issue via execution traces.
- Data/Feature Level: Pinpoints the exact input feature, data pipeline stage, or corrupted training sample responsible.
This hierarchical approach ensures SREs and engineers receive actionable alerts, not just high-level warnings.
04
Temporal & Sequential Analysis
Attribution analyzes the temporal context and sequence of events leading to the anomaly. It reconstructs the causal chain by examining:
- Event Precedence: Did the database error occur before the API latency spike?
- Lagging Indicators: Identifies which metric deviations are primary causes versus secondary effects.
- Time-Series Decomposition: Uses methods like STL decomposition to attribute anomalies to trend, seasonal, or residual components.
This is critical in distributed systems where failures propagate, allowing the system to identify the root cause node in a temporal graph of events, not just the final symptom.
05
Integration with Observability Stacks
Effective attribution is not a standalone process; it ingests and correlates data from the full observability triad:
- Metrics: From Prometheus or Datadog for system performance.
- Traces: From OpenTelemetry or Jaeger for distributed request flows.
- Logs: Centralized logs from Loki or Elasticsearch for contextual events.
The attribution engine creates a unified topology map, linking anomalies in metrics (e.g., high CPU) to specific traces (a slow RPC call) and relevant log errors ("database connection timeout"). This correlation is the foundation for precise, evidence-based blame assignment.
06
Probabilistic & Confidence Scoring
Attribution outputs are not binary; they are accompanied by confidence scores and probability distributions. A system might report: "Feature X is attributed with 85% confidence as the primary cause, with a 70% probability the issue is in Service Y."
- Uncertainty Quantification: Uses Bayesian methods or ensemble techniques to measure attribution certainty.
- Handles Ambiguity: Clearly communicates when multiple root causes are plausible, preventing overconfident, incorrect remediation actions.
- Engineer Trust: High-confidence attributions can trigger automated runbooks, while low-confidence ones are flagged for human review.
DIAGNOSTIC METHODOLOGY COMPARISON
Anomaly Attribution vs. Related Concepts
A technical comparison of methodologies for diagnosing failures and errors in autonomous systems, highlighting the specific focus and output of anomaly attribution.
| Diagnostic Feature | Anomaly Attribution | Root Cause Analysis (RCA) | Fault Localization | Causal Inference |
|---|---|---|---|---|
Primary Objective | Assign responsibility for a detected behavioral deviation to specific features, inputs, or internal states. | Identify the fundamental, underlying reason for a system failure. | Pinpoint the exact faulty component, line of code, or module. | Determine cause-and-effect relationships from data, moving beyond correlation. |
Typical Input | A flagged anomaly or deviation from expected normal system behavior. | A system failure, incident, or significant error. | A system failure or erroneous output. | Observational or experimental data with correlated variables. |
Core Methodology | Feature importance scoring, Shapley values, counterfactual analysis on the anomalous data point. | Structured investigative frameworks (e.g., 5 Whys, Fishbone diagrams). | Spectrum-based reasoning, statistical debugging, delta debugging. | Randomized controlled trials, instrumental variables, structural causal models. |
Output Granularity | Attribution scores for system features/states (e.g., 'Feature X contributed 70% to the anomaly score'). | A narrative or diagram identifying the foundational process or decision that failed. | A specific location identifier (e.g., file name, line number, service endpoint). | A causal graph or estimated treatment effect (e.g., 'Variable A causes a 10-unit increase in B'). |
Temporal Focus | Proximal: Explains the immediate cause of a specific anomalous event. | Ultimate: Seeks the deepest, often procedural or design-related, cause. | Immediate: Identifies the broken component at the time of failure. | General: Infers stable causal relationships that hold across time. |
Automation Potential | High. Algorithmic (e.g., integrated SHAP, LIME). Core to automated root cause analysis. | Medium/Low. Often requires human-led investigation, though can be guided by tools. | High. Core function of automated debugging tools. | High. Driven by statistical and machine learning algorithms for discovery. |
Key Question Answered | "Which features or inputs are most responsible for this specific anomalous output?" | "What is the deepest, systemic reason this failure occurred?" | "Where in the code or system architecture did the fault originate?" | "Does changing variable X directly cause a change in outcome Y?" |
Relation to Pillar | Directly enables Automated Root Cause Analysis within Recursive Error Correction. | Broader investigative discipline; a goal which automated methods aim to achieve. | A more specific, technical sub-task often performed during RCA or debugging. | Provides the mathematical foundation for understanding attribution and causal chains. |
ANOMALY ATTRIBUTION
Frequently Asked Questions
Anomaly attribution is a core technique in automated root cause analysis, focusing on pinpointing the specific features or system states responsible for a detected deviation. These questions address its mechanisms, applications, and distinctions from related concepts.
Anomaly attribution is the process of assigning responsibility for a detected deviation from normal system behavior to specific features, inputs, or internal states. It works by analyzing the difference between the anomalous observation and a baseline of expected behavior, using techniques like Shapley Additive exPlanations (SHAP) or Integrated Gradients to compute a contribution score for each input feature. These scores quantify how much each feature pushed the model's prediction or the system's metric into anomalous territory. The output is a ranked list of features, often visualized as a feature importance plot, that engineers can investigate as potential root causes.
Enabling Efficiency, Speed & Accuracy
Intelligent Analysis, Decision & Execution
We build AI systems for teams that need search across company data, workflow automation across tools, or AI features inside products and internal software.
Talk to Us
Search across company data
Give teams answers from docs, tickets, runbooks, and product data with sources and permissions.
Useful when people spend too long searching or get different answers from different systems.
Enterprise searchRAGPermissions
Read more
Automate internal workflows
Use AI to route work, draft outputs, trigger actions, and keep approvals and logs in place.
Useful when repetitive work moves across multiple tools and teams.
AI agentsWorkflow automationGovernance
Read more
Add AI to products and internal tools
Build assistants, guided actions, or decision support into the software your team or customers already use.
Useful when AI needs to be part of the product, not a separate tool.
AI integrationDecision supportModel routing
Read more
About the author
Prasad Kumkar
CEO & MD, Inference Systems
Prasad Kumkar is the CEO & MD of Inference Systems and writes about AI systems architecture, LLM infrastructure, model serving, evaluation, and production deployment. Over 5+ years, he has worked across computer vision models, L5 autonomous vehicle systems, and LLM research, with a focus on taking complex AI ideas into real-world engineering systems.
His work and writing cover AI systems, large language models, AI agents, multimodal systems, autonomous systems, inference optimization, RAG, evaluation, and production AI engineering.
LinkedIn
Limited slotsGet a Free AI Consultation
Partnered with leading AI, data, and software stack.


How We Work
Custom AI workflows for your Business
One-fit-all AI don't work for modern businesses. At Inferensys, we aim to understand your business & custom requirements; which we use to define most efficient agentic workflows, the data, and the tools for your business.
01
Review the use case
We understand the task, the users, and where AI can actually help.
Read more02
Pick the right approach
We define what needs search, automation, or product integration.
Read more03
Build the first useful version
We implement the part that proves the value first.
Read more04
Improve from there
We add the checks and visibility needed to keep it useful.
Read moreThe first call is a practical review of your use case and the right next step.
Talk to Us