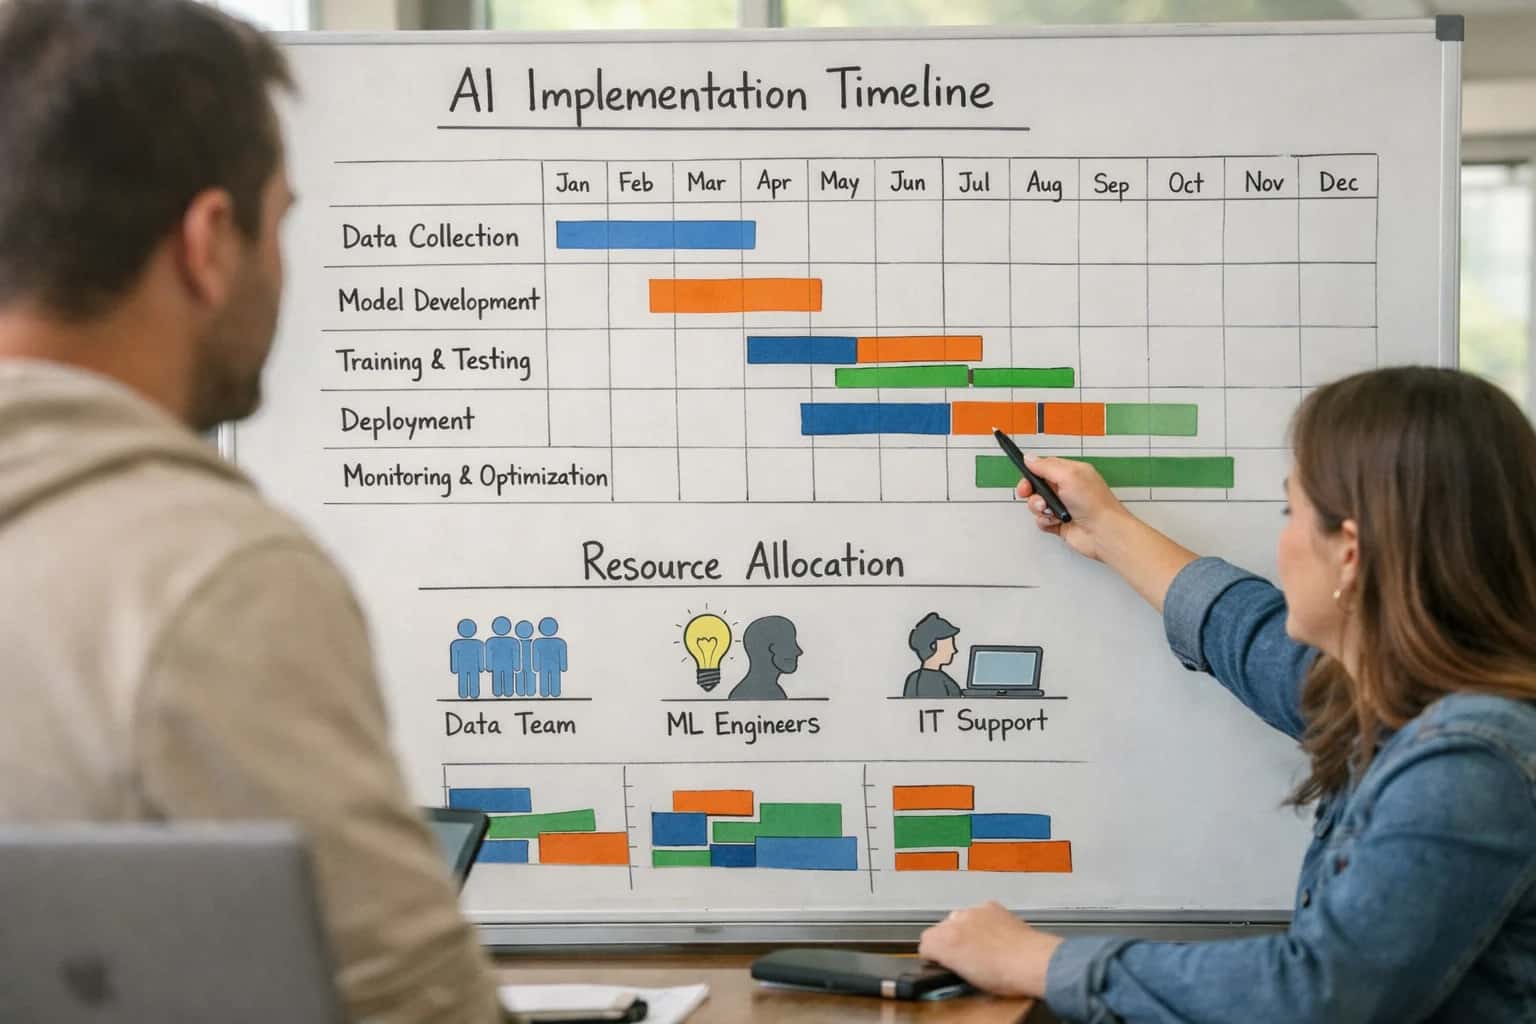
A Gantt Chart is a horizontal bar chart used to illustrate a project schedule, where tasks are listed vertically, time runs horizontally, and bars represent task duration, start dates, and end dates. It provides an immediate visual snapshot of the project timeline, task dependencies (often shown with connecting arrows), resource allocation, and current progress against the plan. This makes it an essential tool for project managers, operations researchers, and CTOs overseeing complex initiatives.

Glossary
Gantt Chart
A Gantt Chart is a visual bar chart used to illustrate a project schedule, displaying tasks along a timeline with start/finish dates, dependencies, and status.
SPATIAL-TEMPORAL SCHEDULING
What is a Gantt Chart?
A Gantt Chart is a foundational project management tool that visually represents a schedule, mapping tasks against a timeline to show durations, dependencies, and progress.
In the context of Heterogeneous Fleet Orchestration and Spatial-Temporal Scheduling, Gantt Charts are adapted to visualize the coordinated movements and task sequences of mixed fleets of autonomous and manual agents. They map agent assignments, travel times, service durations, and charging cycles along a unified timeline, helping planners identify bottlenecks, optimize makespan, and ensure temporal constraints like time windows are met. This application is critical for logistics, warehousing, and manufacturing digital twin simulations.
SPATIAL-TEMPORAL SCHEDULING
Key Components of a Gantt Chart
A Gantt chart is a project management tool that visualizes a schedule as a horizontal bar chart. Its core components transform complex scheduling data—tasks, durations, dependencies, and resources—into an intuitive timeline for planning and monitoring.
01
Task List & Timeline
The foundational axes of the chart. The vertical axis (Y-axis) lists all project tasks or work packages. The horizontal axis (X-axis) represents the project timeline, scaled in appropriate units (days, weeks, months). This creates a matrix where each task's duration is plotted as a bar along the timeline, providing an immediate visual overview of the schedule's scope and timeframe.
02
Task Bars (Duration)
The primary visual element. Each task is represented by a horizontal bar. The bar's left edge indicates the planned start date, and its right edge indicates the planned finish date. The bar's length is directly proportional to the task's duration. In advanced scheduling for heterogeneous fleets, bars can be color-coded or patterned to represent:
- Different resource types (e.g., autonomous mobile robot vs. manual forklift).
- Task priority levels.
- Current status (e.g., on-track, delayed, completed).
03
Dependencies & Links
Lines or arrows connecting task bars that define precedence constraints. These are critical for modeling workflows where one task cannot start until another finishes (Finish-to-Start). Common dependency types include:
- Finish-to-Start (FS): The most common; successor starts after predecessor finishes.
- Start-to-Start (SS): Successor can start once predecessor starts.
- Finish-to-Finish (FF): Successor finishes when predecessor finishes.
- Start-to-Finish (SF): Rare; successor finishes when predecessor starts. In fleet orchestration, these model the sequence for multi-agent tasks, like an AMR unloading before a manual vehicle can transport.
04
Milestones
Significant, zero-duration events or checkpoints in the project lifecycle, represented by diamonds or triangles on the timeline. They mark critical achievements, such as:
- Project phase completions.
- Key deliverable approvals.
- External dependency handoffs.
- Major system go-live events. Milestones are used to track overall progress and synchronize the efforts of different teams or agent groups within a coordinated schedule.
05
Resource Assignment & Allocation
The mapping of tasks to specific resources (agents, machines, personnel). In a basic Gantt chart, this may be noted in the task list. In sophisticated spatial-temporal scheduling systems, this is integrated to show:
- Which specific autonomous mobile robot or vehicle is assigned to a task bar.
- Resource overallocation (conflicts where one agent is scheduled for two simultaneous tasks).
- Utilization rates across the heterogeneous fleet. This component is essential for ensuring the schedule is not just temporally feasible but also resource-feasible.
06
Progress Tracking & Baseline
Mechanisms for monitoring execution against the plan. This often involves:
- A baseline schedule (the original plan), often shown as a faint outline or a different-colored bar.
- Percent-complete shading within task bars, visually indicating progress (e.g., 60% of the bar is filled).
- A vertical 'Today' line that moves with the current date, providing an instant visual comparison between planned work and actual progress. This allows for real-time schedule robustness assessment and triggers online scheduling or real-time replanning when deviations occur.
COMPARISON
Gantt Chart vs. Other Scheduling Visualizations
A comparison of visual scheduling tools used in operations research and heterogeneous fleet orchestration, highlighting their primary use cases, strengths, and limitations for spatial-temporal planning.
| Feature / Metric | Gantt Chart | PERT Chart | Resource Histogram | Discrete-Event Simulation (DES) Dashboard |
|---|---|---|---|---|
Primary Visualization Focus | Task duration & timeline dependencies | Task sequence & critical path | Resource utilization over time | System state evolution & event logs |
Best For Showing | Scheduled start/end dates & overlaps | Precedence relationships & project flow | Capacity constraints & bottlenecks | Dynamic interactions & stochastic behavior |
Temporal Representation | Linear timeline (bars on axis) | Directed acyclic graph (nodes/edges) | Time-series bar/line chart | Animated timeline with event queue |
Spatial Representation Capability | None (abstract tasks) | None (abstract tasks) | None (abstract resources) | High (via integrated 2D/3D viewer for digital twins) |
Handles Dynamic Replanning | Manual update required | Manual update required | Manual update required | Real-time, automated via MPC loop |
Models Uncertainty (Stochastic Durations) | No (deterministic bars) | Yes (via probabilistic time estimates) | No (deterministic utilization) | Yes (core capability via Monte Carlo) |
Directly Optimizes Schedule | No (visualization only) | No (analysis only) | No (visualization only) | Yes (when coupled with solver/RL agent) |
Integration with Optimization Solvers (MIP, CP) | Output visualization | Problem structure input | Constraint visualization | Closed-loop input/output (e.g., for MPC) |
Real-Time Fleet State Overlay | Possible via manual annotation | Not applicable | Possible for resource levels | Core feature (live telemetry feed) |
Use Case in Heterogeneous Fleet Orchestration | High-level mission timeline review | Task dependency analysis for complex jobs | Fleet & charger utilization monitoring | System testing, validation & live command |
SPATIAL-TEMPORAL SCHEDULING
Applications in Fleet Orchestration
In heterogeneous fleet orchestration, Gantt Charts are not static project plans but dynamic, real-time visualizations of agent states, task progress, and resource conflicts across a unified spatiotemporal canvas.
01
Real-Time Fleet Status Dashboard
A live Gantt Chart serves as the primary operational dashboard, visualizing the current state and planned schedule of every agent in the fleet. Each horizontal bar represents an agent (AMR, AGV, or manual vehicle), with color-coded segments showing:
- Active Task Execution (e.g., picking, transporting)
- Travel Time between locations
- Idle/Wait Time (often indicating a bottleneck)
- Scheduled Maintenance or Charging This provides at-a-glance situational awareness for human supervisors, showing which agents are on schedule and which are delayed.
02
Visualizing Temporal Dependencies & Conflicts
Gantt Charts excel at revealing precedence constraints and resource conflicts that are critical in warehouse workflows. For example:
- A packing station cannot start until a fetching robot delivers the required items (precedence).
- Two autonomous mobile robots cannot occupy the same narrow aisle simultaneously (spatial-temporal conflict). Bars are linked with lines to show dependencies, and overlapping bars on shared resources (like a single unload dock) are instantly visible, allowing planners to manually or automatically adjust schedules to resolve deadlocks.
03
Battery-Aware Scheduling Visualization
For electric fleets, Gantt Charts integrate energy constraints directly into the schedule. Bars include distinct segments for:
- Operational runtime at current battery level
- Travel to charging station
- Charging duration (which may vary based on depth of discharge)
- Return to active duty This allows schedulers to proactively plan charging cycles, ensuring high-priority tasks are not assigned to agents nearing low battery, thereby maintaining continuous fleet uptime and adhering to capacity constraints of the electrical infrastructure.
04
Dynamic Replanning & What-If Analysis
When disruptions occur—like an agent failure or a high-priority rush order—the Gantt Chart becomes an interactive tool for online scheduling. Planners can:
- Drag-and-drop task bars to reassign work.
- Visualize the makespan impact of inserting a new job.
- Simulate different priority-based routing rules. Advanced orchestration platforms use this visual model as the front-end for Model Predictive Control (MPC) systems, where the underlying solver continuously re-optimizes the schedule over a receding horizon, with changes reflected in real-time on the chart.
05
Integration with Optimization Solvers
The Gantt Chart is the human-readable output of complex backend optimization algorithms. It represents a feasible solution to a Mixed-Integer Programming (MIP) or Constraint Programming (CP) model that considers:
- Vehicle Routing Problem (VRP) with time windows
- Job Shop Scheduling for stations
- Load balancing across the fleet Solvers like CP-SAT or Gurobi generate the optimal task sequence and timing, which is then rendered as the Gantt visualization. The chart can also display the optimality gap during solver execution.
06
Performance Analytics & Bottleneck Identification
Historical Gantt Charts are aggregated for post-shift analysis, transforming schedule data into performance insights. By analyzing patterns in bar lengths and gaps, operations researchers can identify:
- Chronic bottleneck resources (stations with consistent waiting queues).
- Inefficient agent utilization (excessive idle time).
- Schedule robustness to common delays.
- Average task duration variance versus plan. This data feeds back into the Digital Twin for discrete-event simulation, used to test new scheduling policies and improve schedule robustness before live deployment.
SPATIAL-TEMPORAL SCHEDULING
Frequently Asked Questions
A Gantt Chart is a foundational project management tool for visualizing schedules. In the context of heterogeneous fleet orchestration, it provides a critical temporal view of agent tasks, dependencies, and resource utilization.
A Gantt Chart is a type of bar chart that visually represents a project schedule, displaying tasks or jobs along a timeline with their start dates, end dates, durations, and dependencies. In spatial-temporal scheduling for heterogeneous fleets, it is used to map the planned sequence of tasks (e.g., 'Pick at A1', 'Travel to B3', 'Drop at Loading Dock') for each autonomous mobile robot (AMR) and manual vehicle against a unified timeline. This allows operations managers to see resource allocation, identify potential bottlenecks where multiple agents require the same resource simultaneously, and understand the precedence constraints between tasks. It transforms a complex schedule into an immediately comprehensible visual plan.
Enabling Efficiency, Speed & Accuracy
Intelligent Analysis, Decision & Execution
We build AI systems for teams that need search across company data, workflow automation across tools, or AI features inside products and internal software.
Talk to Us
Search across company data
Give teams answers from docs, tickets, runbooks, and product data with sources and permissions.
Useful when people spend too long searching or get different answers from different systems.
Enterprise searchRAGPermissions
Read more
Automate internal workflows
Use AI to route work, draft outputs, trigger actions, and keep approvals and logs in place.
Useful when repetitive work moves across multiple tools and teams.
AI agentsWorkflow automationGovernance
Read more
Add AI to products and internal tools
Build assistants, guided actions, or decision support into the software your team or customers already use.
Useful when AI needs to be part of the product, not a separate tool.
AI integrationDecision supportModel routing
Read more
About the author
Prasad Kumkar
CEO & MD, Inference Systems
Prasad Kumkar is the CEO & MD of Inference Systems and writes about AI systems architecture, LLM infrastructure, model serving, evaluation, and production deployment. Over 5+ years, he has worked across computer vision models, L5 autonomous vehicle systems, and LLM research, with a focus on taking complex AI ideas into real-world engineering systems.
His work and writing cover AI systems, large language models, AI agents, multimodal systems, autonomous systems, inference optimization, RAG, evaluation, and production AI engineering.
LinkedIn
Limited slotsGet a Free AI Consultation
Partnered with leading AI, data, and software stack.





How We Work
Custom AI workflows for your Business
One-fit-all AI don't work for modern businesses. At Inferensys, we aim to understand your business & custom requirements; which we use to define most efficient agentic workflows, the data, and the tools for your business.
01
Review the use case
We understand the task, the users, and where AI can actually help.
Read more02
Pick the right approach
We define what needs search, automation, or product integration.
Read more03
Build the first useful version
We implement the part that proves the value first.
Read more04
Improve from there
We add the checks and visibility needed to keep it useful.
Read moreThe first call is a practical review of your use case and the right next step.
Talk to Us