A/B testing is a controlled experiment methodology where two or more variants of a system—such as different AI models, prompts, or configurations—are randomly assigned to live user traffic to statistically compare their performance on a predefined primary metric. This randomized controlled trial isolates the causal effect of the change by ensuring user groups are statistically identical except for the variant they receive. The goal is to make data-driven decisions about which version optimizes for a key outcome, such as conversion rate or prediction accuracy, while monitoring guardrail metrics to prevent unintended degradation.
Glossary
A/B Testing
A/B testing is a controlled experiment methodology where two or more variants of a system are randomly assigned to users to statistically compare their performance on a predefined metric.
EVALUATION-DRIVEN DEVELOPMENT
What is A/B Testing?
A/B testing is a foundational methodology within Evaluation-Driven Development for statistically comparing AI systems in production.
In AI and machine learning, A/B testing is critical for validating model improvements, tuning hyperparameters, and deploying new agentic architectures with confidence. It moves development from intuition to causal inference, providing empirical evidence of impact. Effective implementation requires robust traffic splitting, proper statistical power calculation to detect meaningful differences, and rigorous analysis to avoid pitfalls like the peeking problem. This methodology is a core component of a mature MLOps practice, enabling continuous, evidence-based iteration on AI-powered products.
EVALUATION-DRIVEN DEVELOPMENT
Key Components of an A/B Test
A/B testing is a foundational methodology for statistically comparing the performance of different AI models or configurations. A robust test is defined by its core structural and analytical elements.
01
Hypothesis & Primary Metric
Every valid A/B test begins with a falsifiable hypothesis and a single, pre-registered primary metric. The hypothesis states the expected causal relationship (e.g., 'Model B will increase user engagement'). The primary metric (or Key Performance Indicator) is the quantitative measure used to evaluate this hypothesis, such as click-through rate, conversion rate, or a custom model performance score like F1-score or BLEU. Defining this upfront prevents p-hacking and ensures the experiment has a clear success criterion.
02
Variants & Randomization
The core of the experiment involves creating distinct variants (e.g., Control 'A' and Treatment 'B') and assigning subjects to them via randomization. Random assignment is critical for causal inference, as it ensures the groups are statistically equivalent at the start, isolating the variant as the only systematic difference. Assignment is typically done via deterministic hashing of a stable user or session ID to ensure consistent variant assignment. Proper traffic splitting (e.g., 50%/50%) controls the exposure of each variant.
03
Sample Size & Statistical Power
The sample size (number of observations per variant) is calculated before the experiment begins to ensure statistical power. Power is the probability of correctly detecting a true effect. It depends on:
- Minimum Detectable Effect: The smallest improvement you need to detect.
- Significance Level (Alpha): The false positive rate (typically 5%).
- Baseline Metric Value and expected variance. Insufficient sample size leads to underpowered tests that cannot reliably detect real differences, while excessive peeking at results before reaching the target sample size causes the peeking problem, inflating false positives.
04
Statistical Analysis & Inference
Once the sample is collected, statistical tests are applied to the primary metric to determine if observed differences are meaningful. Common methods include:
- T-tests or Z-tests for comparing means.
- Chi-squared tests for proportional data. Results are interpreted using the p-value and confidence interval. A p-value below the alpha threshold suggests statistical significance. The confidence interval provides a range of plausible values for the true average treatment effect. For dynamic allocation, Bayesian inference methods like Thompson sampling can be used.
05
Guardrail & Secondary Metrics
While optimizing for a primary goal, it's essential to monitor guardrail metrics to prevent unintended negative consequences. These are health or quality indicators that must not degrade (e.g., system latency, error rates, user satisfaction scores). Secondary metrics provide additional insight into the variant's impact but are not the definitive success criteria. For AI systems, guardrails might include hallucination rates, inference latency, or performance on specific ethical bias auditing subgroups.
06
Experiment Runtime & Launch Protocol
The operational execution of the test involves a controlled launch protocol. This often starts with a canary launch to a tiny fraction of traffic to check for critical failures. The test then ramps up to its full sample size over a period that accounts for weekly seasonality. The runtime must be sufficient to capture a complete user cohort cycle. Post-experiment, a decision is made based on the statistical analysis, followed by a full rollout, rollback, or further iteration. This process is managed within experiment tracking platforms.
EVALUATION-DRIVEN DEVELOPMENT
How A/B Testing Works: A Step-by-Step Process
A/B testing is a foundational methodology within Evaluation-Driven Development, providing a rigorous, statistical framework for comparing the performance of different AI models or configurations in live production environments.
A/B testing, also known as split testing, is a controlled experiment methodology where two or more variants of a system—such as different AI models, algorithm configurations, or user interface elements—are concurrently presented to randomly assigned segments of live traffic. The core objective is to statistically compare their performance against a single, predefined primary metric, such as click-through rate, conversion rate, or model accuracy, to determine which variant yields a superior outcome. This process transforms subjective decision-making into a data-driven, quantitative evaluation.
The execution follows a strict sequence: hypothesis formulation, variant creation, randomized assignment via deterministic hashing, simultaneous deployment, and statistical analysis of results. Key engineering considerations include calculating statistical power and minimum detectable effect pre-launch, implementing robust traffic splitting, and monitoring guardrail metrics to prevent unintended regressions. Successful A/B testing provides causal inference about the impact of a change, moving beyond correlation to deliver verifiable improvements in system performance.
EVALUATION-DRIVEN DEVELOPMENT
A/B Testing Use Cases in AI & Machine Learning
A/B testing is a foundational methodology for empirically validating AI system changes. These cards detail its core applications in the machine learning lifecycle, from model selection to production monitoring.
01
Model Selection & Deployment
The primary use case for A/B testing in ML is to select the best-performing model for production. This involves statistically comparing a new candidate model (Treatment B) against the current production model (Control A) on key business metrics.
- Metrics: Common evaluation metrics include accuracy, precision/recall, inference latency, throughput, and business KPIs like conversion rate or user engagement.
- Process: User traffic is randomly split, with each group served by a different model variant. Performance is measured over a sufficient sample size to detect a Minimum Detectable Effect.
- Outcome: A statistically significant win on the primary metric, without degradation in guardrail metrics, justifies a full rollout via a canary launch.
02
Hyperparameter & Prompt Optimization
A/B testing provides a rigorous framework for tuning model configurations and prompts. Instead of relying on offline validation scores alone, variants are tested with real users to measure their impact on downstream outcomes.
- Hyperparameter Tuning: Test different learning rates, batch sizes, or regularization strengths to find the configuration that yields the best production performance.
- Prompt Engineering: Compare different prompt architectures, few-shot examples, or system instructions for a Large Language Model. The test measures which variant produces more accurate, helpful, or cost-effective responses.
- Infrastructure Configurations: Evaluate the performance-cost trade-off of different inference optimization settings, such as quantization levels or batch sizes.
03
Feature & Data Pipeline Validation
Before retraining a model with new features or data, A/B tests can validate that the changes improve the live system. This tests the entire pipeline from data ingestion to inference.
- New Feature Integration: Test if adding a new engineered feature or data source (e.g., user behavior history, external API data) improves model predictions.
- Data Pipeline Changes: Validate modifications to data preprocessing, cleaning, or augmentation steps. This catches issues where offline metrics improve but live user experience degrades.
- Synthetic Data Fidelity: Compare a model trained on synthetic data against one trained on real data to assess the real-world utility of the generated dataset.
04
Monitoring for Data & Concept Drift
A/B testing frameworks are used proactively to monitor model health. By continuously running a small, parallel experiment with a recently retrained model, teams can detect performance decay.
- Proactive Drift Detection: A champion-challenger setup, where the 'challenger' is a model retrained on recent data, can signal concept drift if its performance significantly diverges from the stable 'champion'.
- Canary Analysis: A small percentage of traffic is permanently routed to a model retrained on a faster cadence. A sustained performance delta triggers an investigation into changing data distributions.
- **This complements passive drift detection systems that monitor input feature statistics, by directly measuring the impact on the target metric.
05
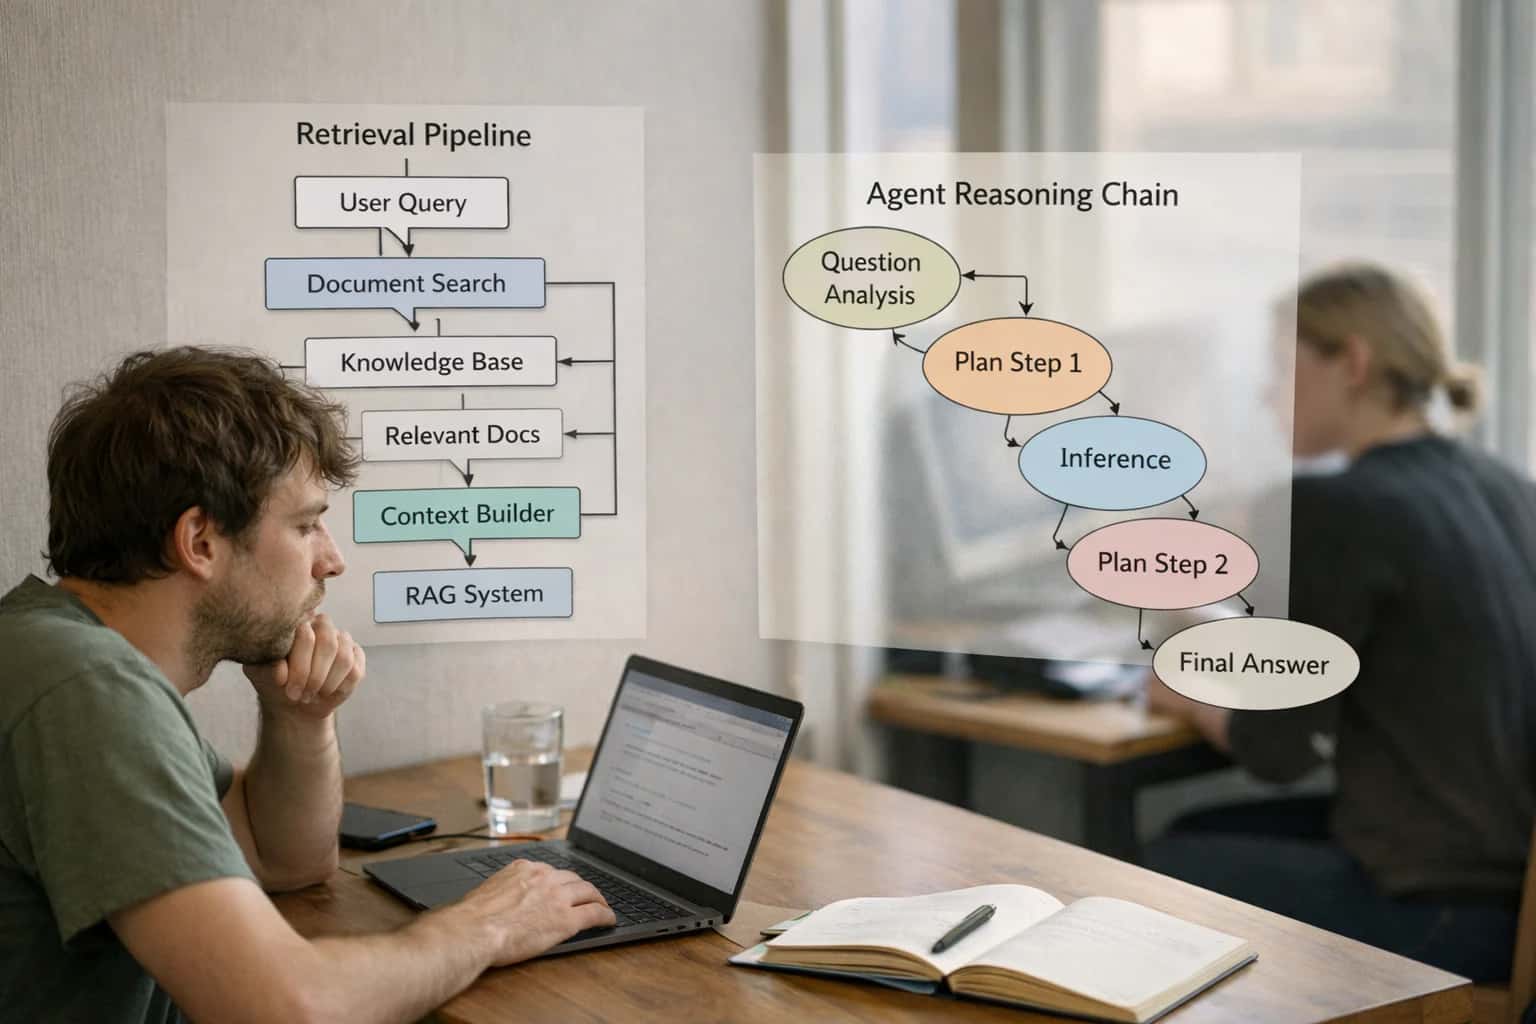
Evaluating Multi-Agent & RAG Systems
For complex AI systems like Multi-Agent Orchestration or Retrieval-Augmented Generation (RAG) pipelines, A/B testing evaluates the holistic performance of different architectures or reasoning strategies.
- Agentic Workflows: Test different agentic reasoning loops, tool-calling strategies, or multi-agent coordination protocols. The metric is the successful completion rate of complex, multi-step tasks.
- RAG Configurations: Compare different vector database retrieval strategies, chunking sizes, or re-ranking models. Evaluate using RAG evaluation metrics like answer faithfulness and context relevance.
- Evaluation Challenge: These systems require carefully designed agentic reasoning trace evaluation and hallucination detection methods to attribute performance differences to specific components.
06
Algorithmic Fairness & Bias Auditing
A/B testing is a critical tool for ethical bias auditing. By analyzing experiment results across user subgroups, teams can detect unfair performance disparities.
- Disparate Impact Analysis: Break down primary metric results by demographic or user segments (e.g., geography, age, language). A statistically significant negative effect for a protected group is a critical failure.
- Causal Evaluation: Provides more direct evidence of a model's causal effect on different groups compared to observational cohort analysis.
- Guardrail Metric: Equity of outcomes often serves as a mandatory guardrail metric. A model that improves the global average but harms a subgroup would not be launched.
METHODOLOGY COMPARISON
A/B Testing vs. Related Experimentation Methods
A comparison of core statistical and engineering methodologies used for evaluating AI models and features in production.
| Feature / Characteristic | A/B Testing (Randomized Controlled Trial) | Multi-Armed Bandit | Multi-Variate Testing | Canary Launch |
|---|---|---|---|---|
Primary Objective | Statistically compare a primary metric between two or more variants to establish causal effect. | Maximize cumulative reward by balancing exploration of uncertain options with exploitation of the best-known option. | Simultaneously test the impact of multiple independent variables (factors) and their interactions on an outcome. | Safely deploy a new version (e.g., AI model) to a small user subset to monitor for stability and critical failures before full rollout. |
Statistical Foundation | Frequentist (p-values, confidence intervals) or Bayesian inference. | Bayesian (e.g., Thompson Sampling) or frequentist regret-minimization algorithms. | Factorial experimental design; analysis of variance (ANOVA). | Operational monitoring; often uses guardrail metrics and error rate thresholds. |
Traffic Allocation | Fixed, pre-determined percentages (e.g., 50%/50%) for the experiment's duration. | Dynamic; automatically shifts traffic towards better-performing variants as evidence accumulates. | Fixed, but across multiple factor combinations (e.g., a full or fractional factorial design). | Phased; starts with a very small percentage (e.g., 1-5%) and increases if stability criteria are met. |
Optimal Use Case | Definitive, high-stakes comparison of a single change (e.g., Model A vs. Model B) on a primary success metric. | Optimizing a continuously running system where the cost of exploration is justified by long-term reward (e.g., recommendation algorithms). | Optimizing complex systems with many interdependent components (e.g., UI layout, pricing page). | Risk mitigation for deploying major new infrastructure, models, or features where stability is the primary concern. |
Key Metric | Primary metric statistical significance (p-value < alpha) and effect size. | Cumulative regret or total reward over time. | Main effects and interaction effects of the tested factors. | System health metrics (error rates, latency, crashes) and guardrail metric performance. |
Decision Timing | At the end of a pre-specified sample size or duration, based on statistical power calculations. | Continuous; the 'best' variant is always being served, but exploration continues. | At the end of the experiment, often requiring larger sample sizes due to multiple comparisons. | After a stability period in the canary phase; a 'go/no-go' decision for full rollout. |
Handles Multiple Variations | ||||
Automatically Optimizes During Run | ||||
Primary Risk Addressed | Making an incorrect inference (Type I/II error) about a treatment's effect. | Opportunity cost of serving suboptimal variants during the learning phase. | Missing complex interactions between variables that affect the outcome. | Catastrophic failures or severe performance degradation affecting all users. |
Requires Fixed Sample Size |
A/B TESTING
Frequently Asked Questions
A/B testing is a foundational methodology in Evaluation-Driven Development for statistically comparing the performance of different AI models or configurations in live environments. These questions address its core principles, implementation, and relationship to related concepts.
A/B testing is a controlled experiment methodology where two or more variants of a system (e.g., different AI models, algorithms, or user interface elements) are randomly assigned to users to statistically compare their performance on a predefined primary metric. It works by splitting incoming user traffic—using deterministic hashing of a user ID—between a control group (Variant A, typically the existing system) and one or more treatment groups (Variant B, the new candidate). Key performance indicators (KPIs) are collected for each group, and statistical tests (like a t-test for continuous metrics or a chi-squared test for conversion rates) are applied to determine if observed differences are statistically significant or likely due to random chance. This process provides a rigorous, data-driven framework for making deployment decisions, central to Evaluation-Driven Development.
Enabling Efficiency, Speed & Accuracy
Intelligent Analysis, Decision & Execution
We build AI systems for teams that need search across company data, workflow automation across tools, or AI features inside products and internal software.
Talk to Us
Search across company data
Give teams answers from docs, tickets, runbooks, and product data with sources and permissions.
Useful when people spend too long searching or get different answers from different systems.
Enterprise searchRAGPermissions
Read more
Automate internal workflows
Use AI to route work, draft outputs, trigger actions, and keep approvals and logs in place.
Useful when repetitive work moves across multiple tools and teams.
AI agentsWorkflow automationGovernance
Read more
Add AI to products and internal tools
Build assistants, guided actions, or decision support into the software your team or customers already use.
Useful when AI needs to be part of the product, not a separate tool.
AI integrationDecision supportModel routing
Read more
About the author
Prasad Kumkar
CEO & MD, Inference Systems
Prasad Kumkar is the CEO & MD of Inference Systems and writes about AI systems architecture, LLM infrastructure, model serving, evaluation, and production deployment. Over 5+ years, he has worked across computer vision models, L5 autonomous vehicle systems, and LLM research, with a focus on taking complex AI ideas into real-world engineering systems.
His work and writing cover AI systems, large language models, AI agents, multimodal systems, autonomous systems, inference optimization, RAG, evaluation, and production AI engineering.
LinkedIn
Limited slotsGet a Free AI Consultation
Partnered with leading AI, data, and software stack.


How We Work
Custom AI workflows for your Business
One-fit-all AI don't work for modern businesses. At Inferensys, we aim to understand your business & custom requirements; which we use to define most efficient agentic workflows, the data, and the tools for your business.
01
Review the use case
We understand the task, the users, and where AI can actually help.
Read more02
Pick the right approach
We define what needs search, automation, or product integration.
Read more03
Build the first useful version
We implement the part that proves the value first.
Read more04
Improve from there
We add the checks and visibility needed to keep it useful.
Read moreThe first call is a practical review of your use case and the right next step.
Talk to Us