Pipeline telemetry is the automated collection, transmission, and aggregation of operational signals—metrics, logs, and traces—from the components of a data pipeline. This instrumentation provides the raw data necessary for pipeline observability, enabling engineers to monitor health, diagnose failures, and understand performance. It transforms opaque workflows into measurable systems by exposing internal state through external outputs.

Glossary
Pipeline Telemetry
Pipeline telemetry is the automated collection and transmission of operational data—metrics, logs, and traces—from data pipeline components to an observability backend for monitoring, troubleshooting, and ensuring data quality.
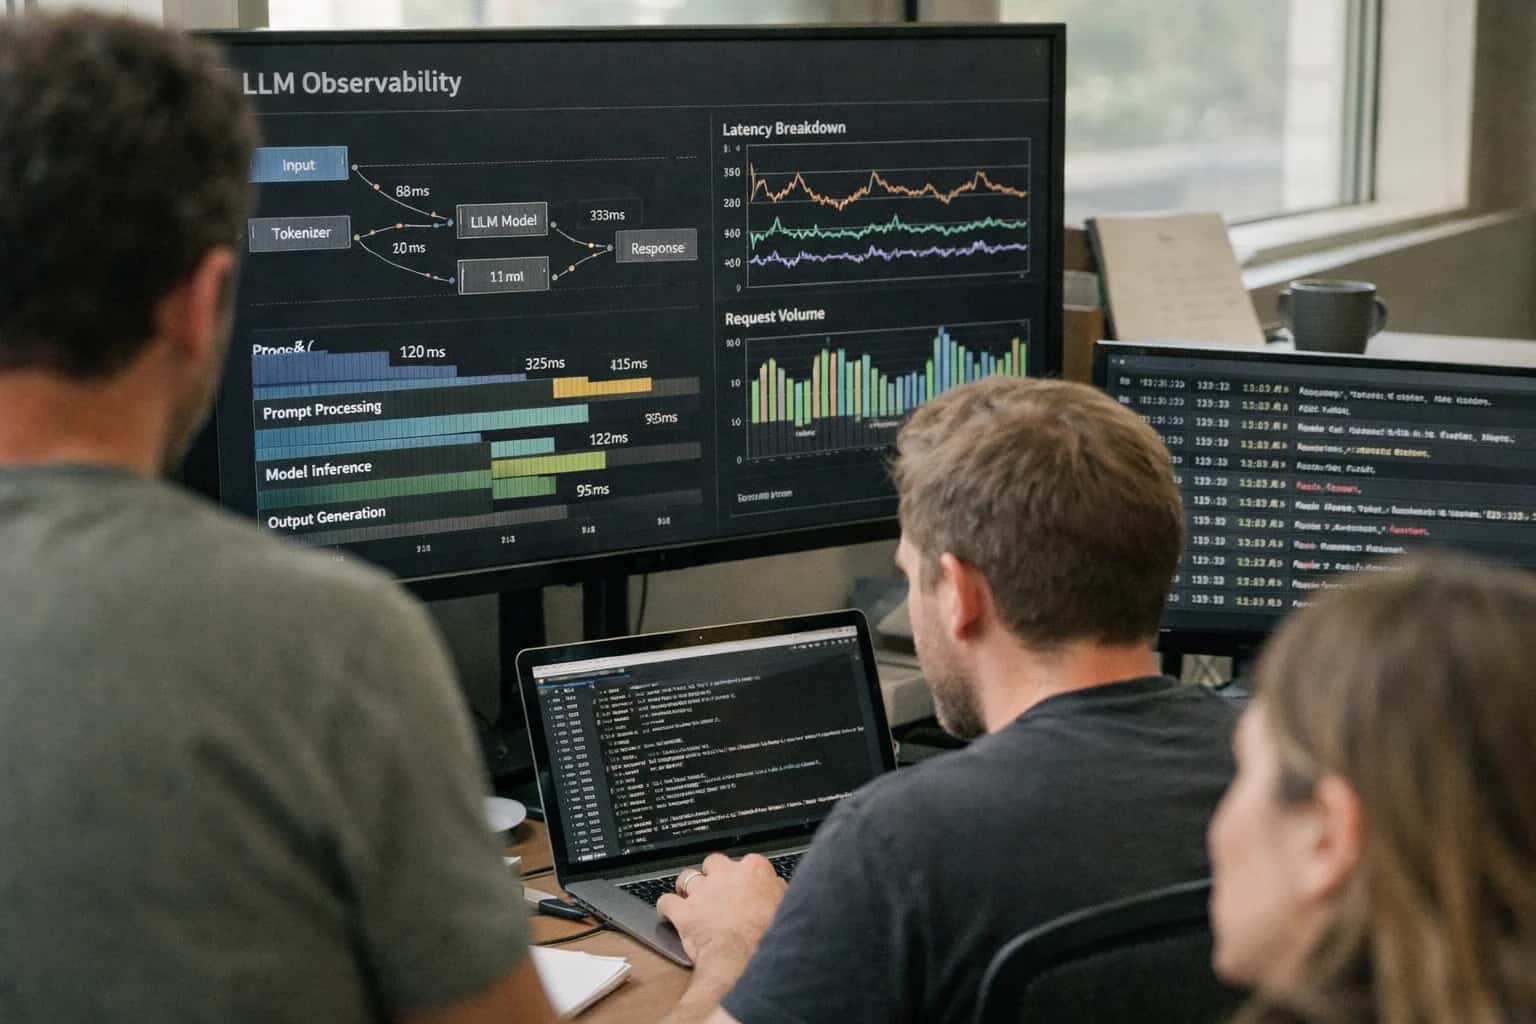
DATA OBSERVABILITY AND QUALITY POSTURE
What is Pipeline Telemetry?
Pipeline telemetry is the automated instrumentation of data processing workflows to collect and transmit operational signals for monitoring and analysis.
Core telemetry signals include throughput metrics, processing latency, error rates, and consumer lag. These are often exported via standards like OpenTelemetry (OTel) to observability backends. Effective telemetry is foundational for defining Service Level Objectives (SLOs), implementing distributed tracing for request flows, and enabling practices like chaos engineering by providing the data needed to validate system resilience under failure conditions.
PIPELINE TELEMETRY
Core Telemetry Data Types (The Three Pillars)
Pipeline telemetry is built on three foundational data types: metrics, logs, and traces. Collectively, they provide the comprehensive signal required to monitor, debug, and understand the health and performance of data processing workflows.
04
The Golden Signals
The Golden Signals are four high-level metric categories, derived from Google's Site Reliability Engineering practices, that provide a universal starting point for monitoring any service or data pipeline.
- Latency: The time it takes to service a request or process a record. Monitor p50, p95, and p99 percentiles.
- Traffic: A measure of demand on the system (e.g., requests per second, bytes ingested per minute).
- Errors: The rate of requests that fail, either explicitly (HTTP 500) or implicitly (business logic failures).
- Saturation: How 'full' a resource is, relative to its capacity (e.g., CPU load, memory usage, queue depth).
Tracking these signals provides a holistic view of pipeline health and user experience.
4
Core Signals
06
Telemetry Data Lifecycle
Pipeline telemetry follows a defined lifecycle from generation to analysis. Understanding this flow is key to building an effective observability stack.
- Instrumentation: Code is added to pipeline components to emit raw signals. This can be manual, automatic, or via an SDK like OpenTelemetry.
- Collection & Export: Emitted signals are gathered by an agent or library and sent (exported) to a backend system. Formats include OTLP (OpenTelemetry Protocol), Prometheus scrape, or vendor-specific protocols.
- Processing & Storage: Backends parse, filter, aggregate, and index the data for efficient querying (e.g., into time-series databases, log indexes, trace stores).
- Analysis & Action: Engineers use dashboards, query languages, and alerting rules to analyze the data, identify issues, and trigger incident management workflows.
This lifecycle is increasingly managed as Observability as Code.
IMPLEMENTATION GUIDE
How Pipeline Telemetry is Implemented
Pipeline telemetry is implemented by instrumenting data workflows to automatically collect, transmit, and analyze operational signals, enabling real-time health monitoring and issue diagnosis.
Implementation begins with instrumentation, embedding lightweight agents or libraries within pipeline components to emit metrics, logs, and traces. These signals are standardized using frameworks like OpenTelemetry (OTel) and exported to an observability backend—such as Prometheus for metrics or Jaeger for traces—via configured exporters. This creates a continuous, low-overhead data stream detailing throughput, latency, errors, and resource saturation, forming the Golden Signals for pipeline health.
The collected telemetry is then structured for analysis. Distributed tracing links operations across services using unique trace IDs, while context propagation ensures causality. Dashboards and alerting rules are codified using Observability as Code principles. Finally, SLOs and error budgets are calculated from this telemetry to govern reliability. This end-to-end flow transforms raw operational data into actionable insights for Data Reliability Engineering.
METRICS FRAMEWORK
Key Pipeline Telemetry Metrics & Their Purpose
A comparison of essential telemetry signals for monitoring the health, performance, and reliability of data processing workflows.
| Metric | Purpose | Common Measurement | Alert Threshold Example |
|---|---|---|---|
Records Processed Per Second (Throughput) | Measures the volume of data a pipeline can handle, indicating system capacity and scaling needs. | records/sec or MB/sec | Sustained drop > 20% from baseline |
End-to-End Latency (P95) | Tracks the time from data ingestion to availability for consumption, measuring processing speed and user experience. | milliseconds or seconds | P95 > 5 seconds |
Error Rate | Quantifies the frequency of processing failures, indicating data quality issues or system instability. | percentage of failed records |
|
Consumer Lag | Monitors the delay between data production and consumption in streaming pipelines, indicating processing bottlenecks. | number of messages or time offset | Lag > 1000 messages or > 30 seconds |
CPU/Memory Utilization | Tracks resource consumption of pipeline components to prevent saturation and guide infrastructure scaling. | percentage of allocated resources | Sustained > 80% for 10 minutes |
Data Freshness | Measures the timeliness of data delivery, ensuring downstream consumers have access to current information. | time since last successful update | Freshness > 15 minutes (SLO violation) |
Dead Letter Queue (DLQ) Size | Indicates the volume of unprocessable messages, highlighting systemic data schema or logic errors. | count of messages | DLQ count > 0 |
Checkpoint Duration/Failure Rate | Assesses the health of state persistence mechanisms critical for fault tolerance and recovery. | duration in ms, percentage failed | Duration > 10s or Failure Rate > 1% |
PIPELINE TELEMETRY
Frequently Asked Questions
Pipeline telemetry is the automated collection and transmission of operational data from a data pipeline's components to an observability backend for analysis. This FAQ addresses common questions about its implementation, benefits, and key components.
Pipeline telemetry is the automated instrumentation of a data pipeline to collect, transmit, and analyze operational data—metrics, logs, and traces—for monitoring and observability. It works by embedding lightweight agents or libraries within pipeline components (sources, processors, sinks) that emit structured data about their performance and state. This data is sent to a centralized observability backend (like Prometheus for metrics, Loki for logs, or Jaeger for traces) where it is aggregated, stored, and visualized. The process enables real-time monitoring of throughput, detection of processing errors, and analysis of data lineage and latency across distributed systems.
Enabling Efficiency, Speed & Accuracy
Intelligent Analysis, Decision & Execution
We build AI systems for teams that need search across company data, workflow automation across tools, or AI features inside products and internal software.
Talk to Us
Search across company data
Give teams answers from docs, tickets, runbooks, and product data with sources and permissions.
Useful when people spend too long searching or get different answers from different systems.
Enterprise searchRAGPermissions
Read more
Automate internal workflows
Use AI to route work, draft outputs, trigger actions, and keep approvals and logs in place.
Useful when repetitive work moves across multiple tools and teams.
AI agentsWorkflow automationGovernance
Read more
Add AI to products and internal tools
Build assistants, guided actions, or decision support into the software your team or customers already use.
Useful when AI needs to be part of the product, not a separate tool.
AI integrationDecision supportModel routing
Read more
About the author
Prasad Kumkar
CEO & MD, Inference Systems
Prasad Kumkar is the CEO & MD of Inference Systems and writes about AI systems architecture, LLM infrastructure, model serving, evaluation, and production deployment. Over 5+ years, he has worked across computer vision models, L5 autonomous vehicle systems, and LLM research, with a focus on taking complex AI ideas into real-world engineering systems.
His work and writing cover AI systems, large language models, AI agents, multimodal systems, autonomous systems, inference optimization, RAG, evaluation, and production AI engineering.
LinkedIn
Limited slotsGet a Free AI Consultation
Partnered with leading AI, data, and software stack.





How We Work
Custom AI workflows for your Business
One-fit-all AI don't work for modern businesses. At Inferensys, we aim to understand your business & custom requirements; which we use to define most efficient agentic workflows, the data, and the tools for your business.
01
Review the use case
We understand the task, the users, and where AI can actually help.
Read more02
Pick the right approach
We define what needs search, automation, or product integration.
Read more03
Build the first useful version
We implement the part that proves the value first.
Read more04
Improve from there
We add the checks and visibility needed to keep it useful.
Read moreThe first call is a practical review of your use case and the right next step.
Talk to Us