A Data Service Level Indicator (SLI) is a quantitative measure of a specific aspect of data service performance, such as the percentage of records delivered within a freshness threshold, which is used to evaluate compliance with a Data SLO. It is the foundational metric in Data Reliability Engineering (DRE), providing an objective, measurable signal of data health—like freshness, completeness, or accuracy—that is continuously monitored. Unlike a subjective assessment, an SLI is a direct, numerical reflection of a critical user experience with data.

Glossary
Data SLI (Service Level Indicator)
A Data Service Level Indicator (SLI) is a quantitative measure of a specific aspect of data service performance, such as the percentage of records delivered within a freshness threshold, which is used to evaluate compliance with a Data SLO.
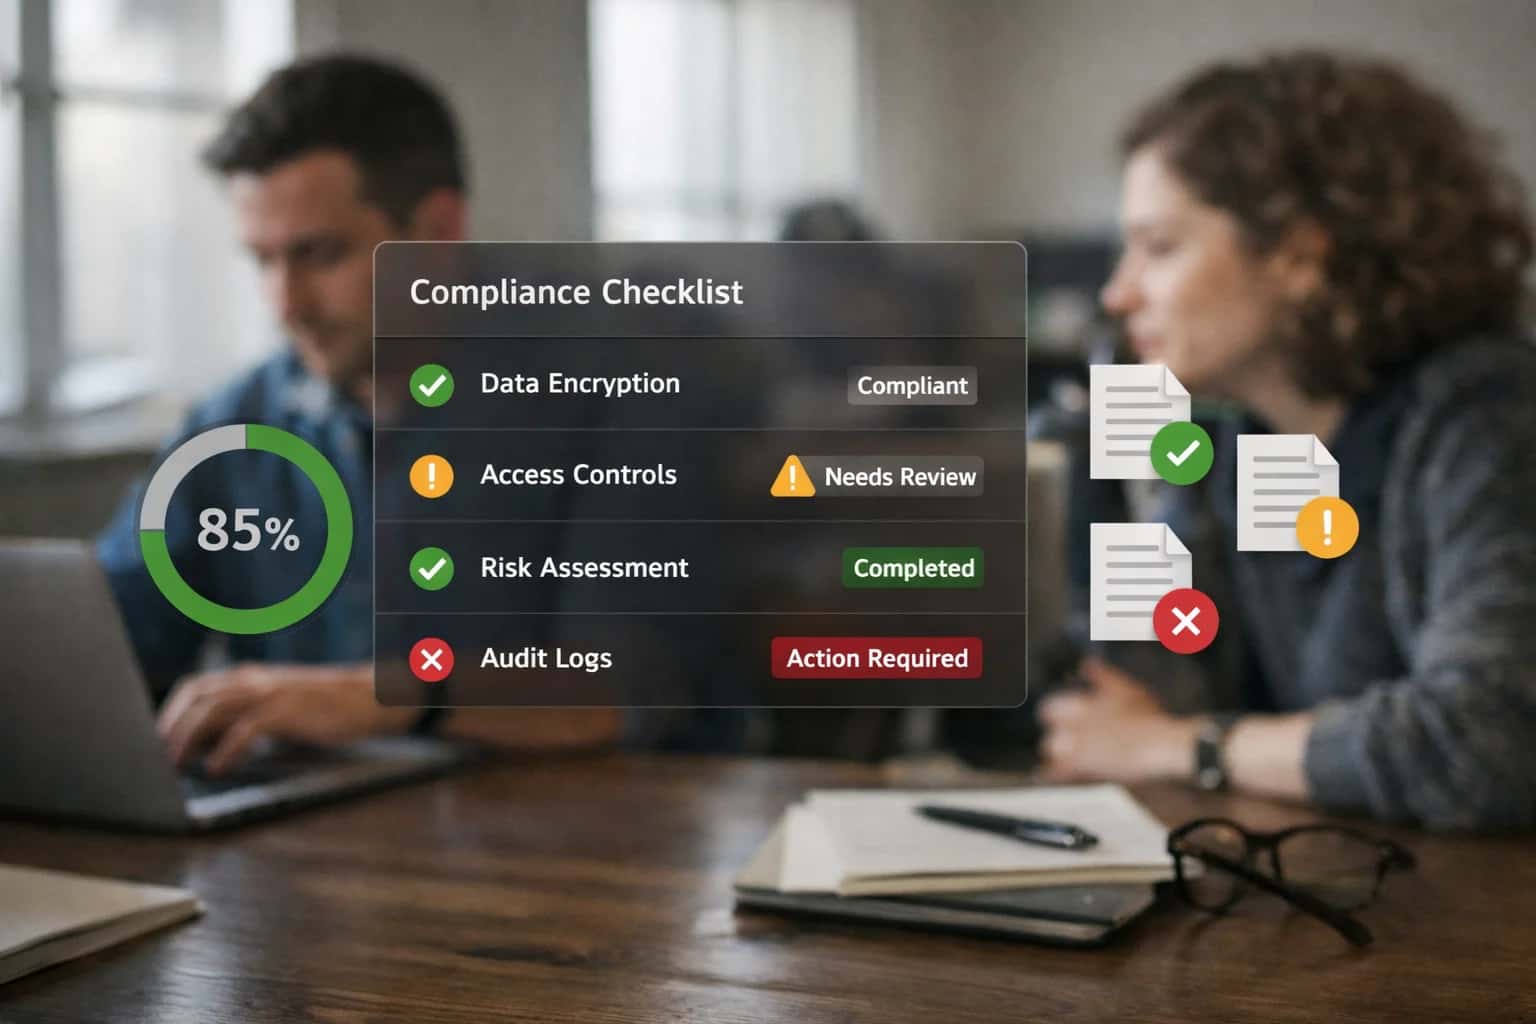
DATA OBSERVABILITY AND QUALITY POSTURE
What is Data SLI (Service Level Indicator)?
A precise, quantitative measure of a specific aspect of data service performance, used to evaluate compliance with a Data Service Level Objective (SLO).
Common Data SLIs measure freshness (time from event to availability), completeness (percentage of expected records present), and accuracy (rate of records passing validation rules). These indicators are derived from automated data observability platforms that instrument pipelines to collect telemetry. By tracking SLIs against defined Data SLOs, teams can manage an explicit error budget, triggering reviews when reliability degrades. This shifts data quality management from reactive firefighting to a proactive, engineering-led discipline focused on measurable outcomes.
DATA OBSERVABILITY AND QUALITY POSTURE
Key Characteristics of a Data SLI
A Data Service Level Indicator (SLI) is a quantitative measure of a specific aspect of data service performance, such as the percentage of records delivered within a freshness threshold. It is the foundational metric used to evaluate compliance with a Data SLO.
01
Quantitative and Measurable
A Data SLI must be a quantifiable metric derived from observable telemetry. It is not a subjective assessment. Examples include:
- Freshness:
(Records delivered on time / Total records expected) * 100 - Completeness:
(Non-null records / Total records) * 100 - Accuracy:
(Records passing validation rules / Total records) * 100 - Latency:
P99 time from source event to table updateThese are expressed as ratios, percentages, or distributions over a defined measurement window.
02
User-Centric and Actionable
An effective SLI measures an aspect of data quality that directly impacts downstream consumers and business outcomes. It answers the question: "What does the user of this data product care about?"
- For a dashboard: Freshness is critical.
- For a machine learning feature store: Completeness and distribution stability are key.
- For financial reporting: Accuracy is paramount. The SLI must be tied to a clear, achievable SLO that, if violated, triggers a meaningful operational response.
03
Defined Over a Time Window
SLIs are not point-in-time measurements; they are aggregated over a specific rolling time window. This window defines the evaluation period for SLO compliance.
- Common windows: 28-day or 30-day rolling periods.
- Calculation: The SLI value (e.g., 99.9% freshness) is the result of aggregating all measurement samples within that window. This temporal aggregation smooths out brief anomalies and provides a stable basis for error budget calculation, ensuring the SLO reflects sustained performance.
04
Aligned with a Specific Data Asset
Each SLI is scoped to a discrete, identifiable data asset or pipeline. It does not measure the health of an entire platform vaguely.
- Scope Examples: A specific database table, a Kafka topic, a materialized view, or an API endpoint serving data.
- Ownership: The scoping implies clear data product ownership, enabling accountability. A
customer_orderstable has different SLIs than aweb_clickstreamtopic. This precise scoping is essential for effective incident triage and root cause analysis when SLI performance degrades.
05
Instrumented via Automated Observability
SLI measurement must be fully automated through instrumentation in the data pipeline. Manual checks are not scalable or reliable.
- Implementation: Achieved via data observability platforms that inject telemetry hooks to collect metrics on freshness, volume, schema, and lineage.
- Integration: SLI dashboards and alerts are fed directly from this telemetry, often using tools like Grafana or platform-native UIs.
- Key Practice: This aligns with Data Monitoring as Code, where SLI definitions are version-controlled configurations.
06
The Foundation for SLOs & Error Budgets
The SLI is the raw measurement; the Data SLO is the target threshold for that measurement (e.g., "Freshness SLI >= 99.5%").
- Error Budget: Derived directly from the SLO. If the SLO is 99.5% over 30 days, the error budget is 0.5% unreliability, or approximately 3.6 hours of "downtime."
- Governance Function: This framework creates a data-driven feedback loop. Consuming the error budget on firefighting triggers a review of pipeline stability and investment priorities. Thus, a well-defined SLI enables Data Reliability Engineering (DRE) practices.
OPERATIONALIZATION
How Data SLIs Work in Practice
A Data Service Level Indicator (SLI) is a quantitative measure of a specific aspect of data service performance, such as the percentage of records delivered within a freshness threshold, which is used to evaluate compliance with a Data SLO.
In practice, a Data SLI is implemented as a continuously monitored metric derived from pipeline telemetry. For example, a freshness SLI might measure the percentage of time a critical table is updated within one hour of source data arrival. This raw measurement is compared against a Data SLO target, such as 99.9% freshness, to determine if the service is meeting its reliability objectives. The gap between the SLI value and the SLO defines the consumed error budget.
Effective SLIs are specific, measurable, and actionable. They are defined collaboratively by data producers and consumers to reflect business-critical data characteristics like completeness, accuracy, or latency. These indicators are typically computed over a rolling window (e.g., 28 days) and visualized on dashboards, providing a real-time, objective signal of data health that triggers alerts or automated actions when thresholds are breached.
QUANTITATIVE MEASURES
Common Examples of Data SLIs
A Data Service Level Indicator (SLI) is a specific, measurable metric used to track the performance of a data service. Below are concrete examples of SLIs that form the basis for Data SLOs and reliability engineering.
02
Completeness & Volume
Measures whether all expected data records have been successfully delivered and processed, guarding against silent data loss.
- Primary SLI:
(Records received / Records expected) * 100 - Example: A nightly batch job expecting 10 million transaction records uses an SLI to verify 100% arrival. A drop to 95% triggers an alert.
- Related Metrics: Row count variance, file count checks, and ensuring no missing partitions or slices in time-series data.
03
Accuracy & Validity
Measures the correctness and adherence of data to defined schemas, formats, and business rules.
- Primary SLI:
(Records passing validation rules / Total records processed) * 100 - Examples:
- Schema Conformance: Percentage of records matching the expected column types and nullability constraints.
- Business Rule Adherence: Percentage of financial transactions where
debit + credit = 0. - Referential Integrity: Percentage of foreign key values that have a corresponding primary key in the parent table.
04
Availability & Uptime
Measures the accessibility and readiness of a data asset or pipeline endpoint for consumption.
- Primary SLI:
(Successful queries or accesses / Total attempts) * 100 - Measurement: Often calculated via synthetic probes that attempt to read from a table, API, or materialized view at regular intervals.
- Distinction: This SLI focuses on the service being reachable and responsive, not the internal quality of the data itself. It is closely tied to pipeline execution success rates.
05
Correctness (Business Logic)
Measures the fidelity of data to real-world entities and processes, often requiring cross-system reconciliation.
- Primary SLI:
(Records reconciling with source of truth / Total records) * 100 - Complex Example: In an e-commerce pipeline, the SLI could be the percentage of orders where the pipeline's calculated
total_revenuematches the sum of individual item charges in the transactional billing system. - Implementation: Often requires dual-write checks or end-to-end reconciliation jobs that compare aggregated metrics across different systems.
06
Distribution & Uniqueness
Measures the statistical shape and integrity of data values to detect drift or duplication.
- Common SLIs:
- Uniqueness:
(Count of distinct values in a key column / Total row count) * 100. An SLI target might be 100% for primary keys. - Distribution Stability: Tracking the KL divergence or population stability index (PSI) for critical column values (e.g.,
country_codedistribution) compared to a historical baseline. A significant shift indicates potential data corruption or source change.
- Uniqueness:
DATA RELIABILITY ENGINEERING
Data SLI vs. SLO vs. SLA: A Comparison
A comparison of the three core components of the Data Reliability Engineering (DRE) framework, which define, measure, and enforce data quality and reliability.
| Feature | Data SLI (Service Level Indicator) | Data SLO (Service Level Objective) | Data SLA (Service Level Agreement) |
|---|---|---|---|
Core Definition | A quantitative measure of a specific aspect of data service performance. | A target level of reliability for a data quality characteristic, expressed as a percentage over time. | A formal contract defining the committed level of service, including consequences for breach. |
Primary Role | Measurement. The raw metric. | Internal Goal. The target for the SLI. | External Promise. The business commitment to consumers. |
Typical Format | Direct measurement (e.g., '98.5% of records delivered within 5 minutes'). | Target threshold (e.g., 'Freshness SLO: 99% of records delivered within 5 minutes, measured monthly'). | Legal/contractual document with guarantees and remedies (e.g., 'Guaranteed Freshness: 95% of records within 10 minutes, or service credit applies'). |
Audience & Purpose | Engineering & SRE teams. For monitoring and internal diagnostics. | Product & engineering leadership. For setting internal reliability priorities and error budgets. | Business stakeholders & data consumers. For defining formal expectations and business risk. |
Enforcement Mechanism | Automated monitoring and instrumentation. | Error budget tracking and internal review processes. | Contractual penalties, service credits, or formal breach procedures. |
Flexibility | High. Can be adjusted based on monitoring needs. | Moderate. Changed via internal review to align with product goals. | Low. Requires formal renegotiation with stakeholders. |
Example Metric | Data Freshness SLI: Percentage of records arriving within latency threshold. | Data Freshness SLO: Target of 99.5% freshness over a rolling 30-day window. | Data Freshness SLA: Commitment of 99% freshness per calendar month, with financial penalty for non-compliance. |
Relationship | Feeds into the SLO. The SLI is measured against the SLO target. | Derived from SLIs and business needs. Defines the error budget. | Based on the SLO, but typically set at a lower, more conservative threshold to account for risk. |
DATA SLI
Frequently Asked Questions
A Data Service Level Indicator (SLI) is a quantitative measure of a specific aspect of data service performance. This FAQ addresses common questions about how Data SLIs are defined, measured, and used to ensure data reliability.
A Data Service Level Indicator (SLI) is a quantitative, measurable key performance indicator (KPI) that tracks a specific dimension of a data product's health or performance over time. It is the raw measurement used to evaluate compliance with a Data Service Level Objective (SLO). Common examples include the percentage of records delivered within a freshness threshold (e.g., 99% of records arrive within 5 minutes of source generation) or the percentage of records that pass all defined data quality rules.
Unlike a subjective assessment, an SLI is a direct, numerical observation derived from system telemetry. It forms the foundational metric upon which reliability targets (SLOs) and operational error budgets are based, providing an objective basis for Data Reliability Engineering (DRE) practices.
Enabling Efficiency, Speed & Accuracy
Intelligent Analysis, Decision & Execution
We build AI systems for teams that need search across company data, workflow automation across tools, or AI features inside products and internal software.
Talk to Us
Search across company data
Give teams answers from docs, tickets, runbooks, and product data with sources and permissions.
Useful when people spend too long searching or get different answers from different systems.
Enterprise searchRAGPermissions
Read more
Automate internal workflows
Use AI to route work, draft outputs, trigger actions, and keep approvals and logs in place.
Useful when repetitive work moves across multiple tools and teams.
AI agentsWorkflow automationGovernance
Read more
Add AI to products and internal tools
Build assistants, guided actions, or decision support into the software your team or customers already use.
Useful when AI needs to be part of the product, not a separate tool.
AI integrationDecision supportModel routing
Read more
About the author
Prasad Kumkar
CEO & MD, Inference Systems
Prasad Kumkar is the CEO & MD of Inference Systems and writes about AI systems architecture, LLM infrastructure, model serving, evaluation, and production deployment. Over 5+ years, he has worked across computer vision models, L5 autonomous vehicle systems, and LLM research, with a focus on taking complex AI ideas into real-world engineering systems.
His work and writing cover AI systems, large language models, AI agents, multimodal systems, autonomous systems, inference optimization, RAG, evaluation, and production AI engineering.
LinkedIn
Limited slotsGet a Free AI Consultation
Partnered with leading AI, data, and software stack.





How We Work
Custom AI workflows for your Business
One-fit-all AI don't work for modern businesses. At Inferensys, we aim to understand your business & custom requirements; which we use to define most efficient agentic workflows, the data, and the tools for your business.
01
Review the use case
We understand the task, the users, and where AI can actually help.
Read more02
Pick the right approach
We define what needs search, automation, or product integration.
Read more03
Build the first useful version
We implement the part that proves the value first.
Read more04
Improve from there
We add the checks and visibility needed to keep it useful.
Read moreThe first call is a practical review of your use case and the right next step.
Talk to Us