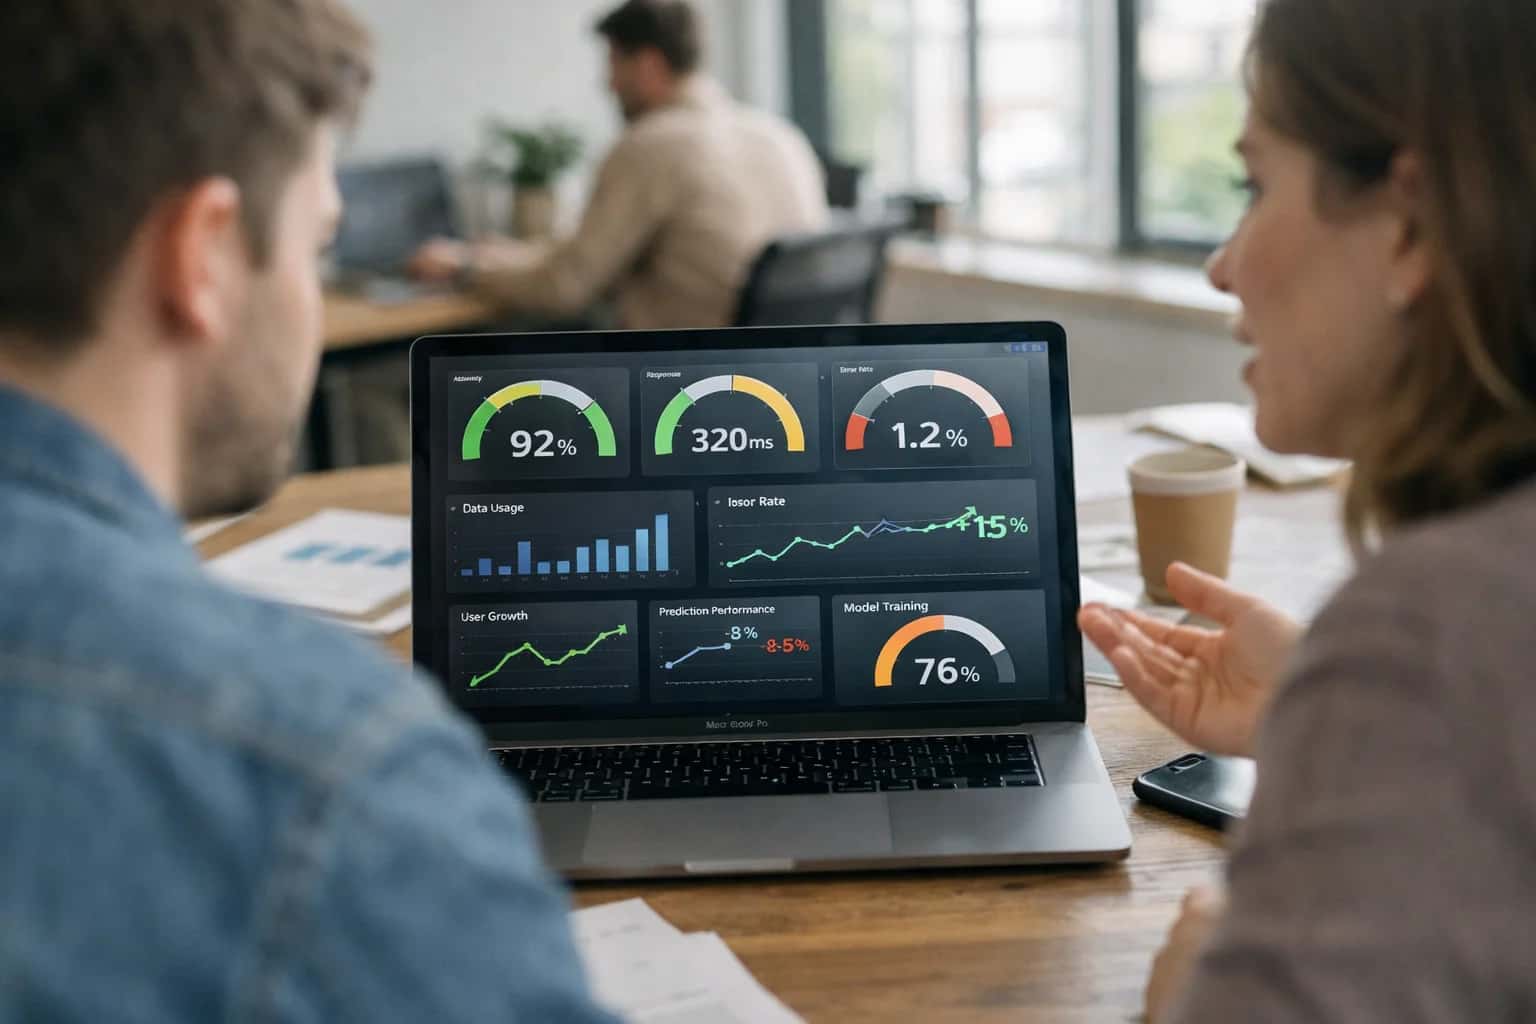
A model monitoring dashboard is a centralized observability interface that visualizes key metrics—such as prediction drift, data quality, and business KPIs—to provide the human oversight necessary for configuring and validating automated retraining triggers. It aggregates telemetry from the inference service, data pipelines, and business systems into a single pane of glass, enabling engineers to correlate model degradation with underlying data shifts or pipeline failures.

Glossary
Model Monitoring Dashboard
A model monitoring dashboard is a centralized observability interface that visualizes key metrics—such as prediction drift, data quality, and business KPIs—to provide human oversight for configuring automated retraining triggers.
AUTOMATED RETRAINING SYSTEMS
What is a Model Monitoring Dashboard?
A model monitoring dashboard is the central observability interface for tracking the health and performance of machine learning models in production, providing the human oversight necessary to configure and validate automated retraining triggers.
The dashboard is the primary tool for interpreting automated alerts from drift detection triggers and performance degradation triggers, allowing teams to decide whether to initiate a retraining cycle. By visualizing trends in concept drift and covariate drift alongside infrastructure metrics like latency, it transforms raw monitoring data into actionable insights for maintaining Continuous Model Learning Systems.
MODEL MONITORING DASHBOARD
Core Metrics Visualized
A model monitoring dashboard is the central observability interface for tracking the health, performance, and behavior of machine learning models in production. It visualizes key metrics to enable data-driven decisions about automated retraining and deployment.
01
Prediction & Data Drift
This card tracks shifts in the model's operational environment. Prediction drift monitors changes in the distribution of the model's output scores over time. Data drift (or covariate drift) tracks changes in the statistical properties of the input feature distributions. Common detection methods include Population Stability Index (PSI), Kullback-Leibler (KL) divergence, and Kolmogorov-Smirnov tests. A significant drift indicates the model's assumptions about the world are no longer valid, serving as a primary trigger for automated retraining pipelines.
02
Performance Metrics
This card displays the model's accuracy against ground truth. For classification models, key metrics include:
- Accuracy, Precision, Recall, F1-Score: Standard measures of predictive correctness.
- AUC-ROC: The area under the Receiver Operating Characteristic curve, indicating the model's ability to discriminate between classes.
- Log Loss/Brier Score: Measures the calibration and confidence of probabilistic predictions. For regression, Mean Absolute Error (MAE), Mean Squared Error (MSE), and R-squared are tracked. A sustained drop in these metrics is a direct performance degradation trigger.
03
Data Quality & Integrity
This card monitors the health of the incoming inference data pipeline, acting as a data quality gate. It tracks:
- Missing Value Rates: Sudden spikes can indicate upstream pipeline failures.
- Schema Violations: Alerts when feature names or data types change unexpectedly.
- Outlier Detection: Flags anomalous feature values using statistical bounds (e.g., IQR) or ML models.
- Training-Serving Skew: Compares summary statistics (mean, variance) of live data with the data the model was trained on. This skew detector is critical for catching silent failures.
04
Business & Operational KPIs
This card translates model performance into business impact, which is often the ultimate retraining trigger. Metrics are highly domain-specific:
- Finance: Fraud capture rate, false positive cost.
- E-commerce: Click-through rate (CTR), conversion rate, average order value.
- Healthcare: Readmission rate prediction accuracy.
- Operational: Inference Latency (P50, P95, P99), Throughput (requests per second), and Error Rates (5xx HTTP errors). Degradation here can trigger a canary deployment rollback or urgent retraining.
05
Concept Drift & Explainability
This card goes beyond data drift to detect concept drift, where the relationship between inputs and the target variable changes. Methods include monitoring performance on a delayed-label holdout set or using unsupervised drift detectors on the error distribution. Integrated explainability tools like SHAP (SHapley Additive exPlanations) or LIME (Local Interpretable Model-agnostic Explanations) show feature importance for individual predictions and aggregates, helping diagnose why drift is occurring. A concept drift alarm from this card is a high-signal retraining trigger.
06
Resource & Pipeline Health
This card provides system-level observability for the automated retraining infrastructure itself. It monitors:
- Pipeline Success/Failure Rates: For the ML pipeline orchestrator (e.g., Airflow DAG runs).
- Compute Utilization: GPU/CPU hours and memory usage during training, governed by a compute budget scheduler.
- Data Pipeline Latency: Time for new data to move from source to the feature store trigger.
- Model Registry: Tracks model versions, lineage, and the status of automated model promotion. Failures here activate the pipeline failure handler.
MODEL MONITORING DASHBOARD
Role in Automated Retraining Systems
A model monitoring dashboard is the central observability interface for an automated retraining system, providing the human oversight necessary to configure, validate, and trust automated triggers.
A model monitoring dashboard is a centralized observability interface that visualizes key performance, data, and business metrics to provide the human oversight necessary for configuring and validating automated retraining triggers. It aggregates telemetry from drift detectors, performance trackers, and data quality checks into a single pane of glass, enabling engineers to correlate alerts and set precise thresholds for triggers like concept drift alarms or performance degradation triggers. This dashboard is the primary control panel where the automated system's logic is defined and its decisions are audited.
Within an automated retraining architecture, the dashboard's role is to translate raw system telemetry into actionable insights for pipeline governance. It allows MLOps engineers to visually verify that a drift detection trigger is firing for legitimate distribution shifts, not data pipeline artifacts. By tracking metrics like retraining SLA adherence and model version performance over time, it provides the continuous feedback required to tune the retraining cadence and automated model promotion rules, ensuring the system remains both responsive and reliable without constant manual intervention.
HUMAN OVERSIGHT VS. AUTOMATED ACTION
Dashboard vs. Automated Triggers
This table compares the primary functions of a model monitoring dashboard, which provides human-interpretable observability, with automated retraining triggers, which execute predefined actions without human intervention.
| Feature / Metric | Model Monitoring Dashboard | Automated Retraining Triggers |
|---|---|---|
Primary Purpose | Visualization and human alerting for investigation and configuration. | Execution of predefined actions (e.g., retraining, rollback) based on rules. |
Core Output | Charts, graphs, logs, and alerts sent to engineers (Slack, email). | A triggered pipeline job (e.g., in Airflow, Kubeflow) or deployment event. |
Decision Agent | Human operator (ML Engineer, Data Scientist). | Automated system (orchestrator, rule engine). |
Latency to Action | Minutes to hours, dependent on human response time. | < 1 sec to minutes for rule evaluation and pipeline initiation. |
Key Input Metrics | Prediction drift, feature drift, accuracy, precision, recall, data quality stats. | Boolean thresholds from drift detectors (e.g., p-value < 0.01) or performance metrics (e.g., accuracy < 95%). |
Configuration Interface | GUI for setting alert thresholds and chart parameters. | YAML/JSON config files or code defining trigger logic and thresholds. |
Failure Mode | Alert fatigue, missed signals, misinterpretation of charts. | False positives triggering unnecessary retraining, or missed drift due to poor threshold tuning. |
Integration Point | Monitoring and observability platforms (e.g., Grafana, Evidently, WhyLabs). | Pipeline orchestrators and model registries (e.g., Airflow, MLflow, Kubeflow). |
MODEL MONITORING
Frequently Asked Questions
A model monitoring dashboard is the central observability hub for machine learning operations, providing the human oversight necessary to configure and validate automated retraining systems. These FAQs address its core functions, key metrics, and integration within continuous learning architectures.
A model monitoring dashboard is a centralized observability interface that visualizes key metrics—such as prediction drift, data quality, and business KPIs—to provide the human oversight necessary for configuring and validating automated retraining triggers. It works by ingesting real-time telemetry from the inference serving layer and the upstream data pipelines, applying statistical tests and ML-based detectors, and presenting the results through charts, alerts, and logs. This allows MLOps engineers to diagnose issues like concept drift or training-serving skew and fine-tune the thresholds that control automated systems like drift detection triggers and performance degradation triggers.
Enabling Efficiency, Speed & Accuracy
Intelligent Analysis, Decision & Execution
We build AI systems for teams that need search across company data, workflow automation across tools, or AI features inside products and internal software.
Talk to Us
Search across company data
Give teams answers from docs, tickets, runbooks, and product data with sources and permissions.
Useful when people spend too long searching or get different answers from different systems.
Enterprise searchRAGPermissions
Read more
Automate internal workflows
Use AI to route work, draft outputs, trigger actions, and keep approvals and logs in place.
Useful when repetitive work moves across multiple tools and teams.
AI agentsWorkflow automationGovernance
Read more
Add AI to products and internal tools
Build assistants, guided actions, or decision support into the software your team or customers already use.
Useful when AI needs to be part of the product, not a separate tool.
AI integrationDecision supportModel routing
Read more
About the author
Prasad Kumkar
CEO & MD, Inference Systems
Prasad Kumkar is the CEO & MD of Inference Systems and writes about AI systems architecture, LLM infrastructure, model serving, evaluation, and production deployment. Over 5+ years, he has worked across computer vision models, L5 autonomous vehicle systems, and LLM research, with a focus on taking complex AI ideas into real-world engineering systems.
His work and writing cover AI systems, large language models, AI agents, multimodal systems, autonomous systems, inference optimization, RAG, evaluation, and production AI engineering.
LinkedIn
Limited slotsGet a Free AI Consultation
Partnered with leading AI, data, and software stack.





How We Work
Custom AI workflows for your Business
One-fit-all AI don't work for modern businesses. At Inferensys, we aim to understand your business & custom requirements; which we use to define most efficient agentic workflows, the data, and the tools for your business.
01
Review the use case
We understand the task, the users, and where AI can actually help.
Read more02
Pick the right approach
We define what needs search, automation, or product integration.
Read more03
Build the first useful version
We implement the part that proves the value first.
Read more04
Improve from there
We add the checks and visibility needed to keep it useful.
Read moreThe first call is a practical review of your use case and the right next step.
Talk to Us