Semantic similarity of GO terms quantifies functional relatedness by measuring the specificity of the most informative common ancestor shared by two terms in the Gene Ontology graph. Unlike simple string matching, this approach leverages the structured knowledge in the ontology to compute a numerical score reflecting biological closeness, where terms sharing a highly specific parent are deemed more similar than those meeting only at the root.

Glossary
Semantic Similarity of GO Terms
A computational measure that quantifies the functional relatedness between two Gene Ontology terms based on the information content of their shared ancestors in the ontology graph.
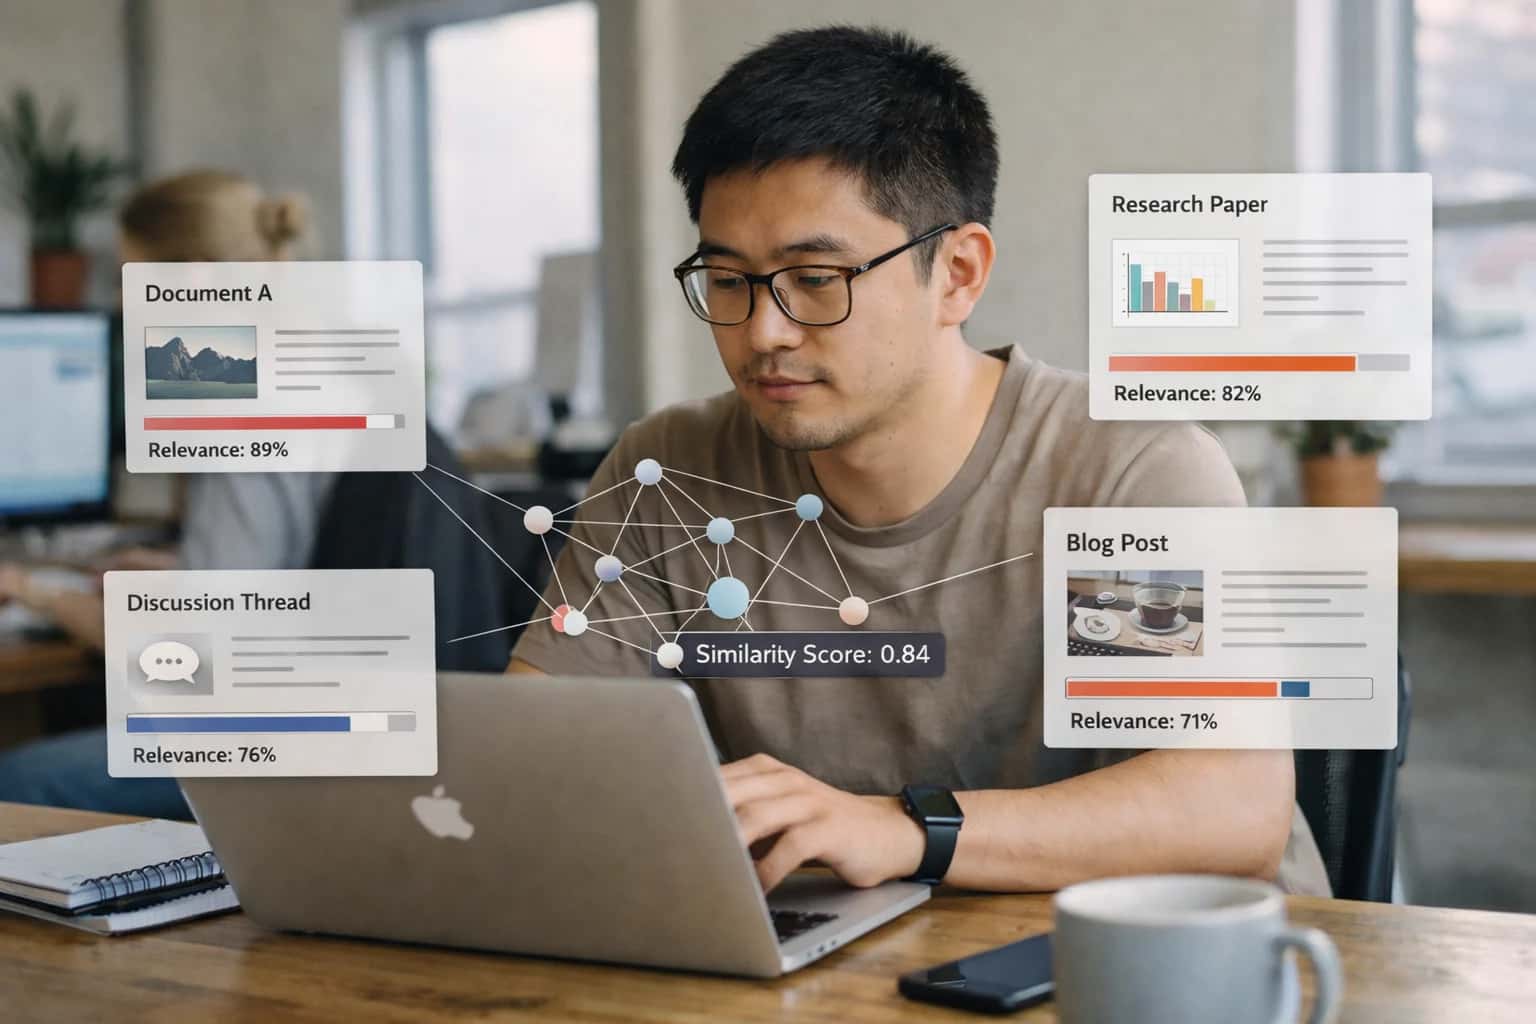
What is Semantic Similarity of GO Terms?
Semantic similarity of GO terms is a computational measure that quantifies the functional relatedness between two Gene Ontology terms by analyzing the information content of their shared ancestors within the ontology's directed acyclic graph structure.
Common algorithms like Resnik, Lin, and Jiang-Conrath calculate this similarity using the information content of a term, defined as the negative log probability of its occurrence in a reference corpus. These measures are foundational for functional coherence analysis, enabling researchers to validate gene clusters, prioritize candidate genes, and interpret high-throughput experiments by comparing sets of annotations rather than individual terms.
COMPUTATIONAL ONTOLOGY METRICS
Key Characteristics of Semantic Similarity Measures
Semantic similarity measures quantify the functional relatedness between Gene Ontology terms by analyzing the structure of the ontology graph and the information content of shared ancestral nodes.
01
Graph-Based vs. Information Content Approaches
Two fundamental paradigms exist for computing GO term similarity. Graph-based methods rely purely on the topology of the ontology—measuring edge distances, shortest path lengths, or the depth of the lowest common ancestor (LCA). Information content (IC) methods weight each term by its specificity: rare, specific terms carry high IC, while broad, general terms carry low IC.
- Resnik's measure: Uses only the IC of the LCA
- Lin's measure: Normalizes by the IC of both query terms
- Jiang & Conrath: Incorporates edge distance with IC weighting
- Wang's measure: Uses a graph-based local topology weighting without requiring corpus statistics
02
Lowest Common Ancestor (LCA) Resolution
The lowest common ancestor is the most specific term that subsumes both query terms in the ontology hierarchy. Its identification is the critical computational step in most similarity algorithms. In the GO directed acyclic graph (DAG), a term pair may have multiple common ancestors due to multiple parentage—the LCA is the one with maximum depth or information content.
- Multiple inheritance in GO complicates LCA selection
- The true LCA may not be unique; disambiguation strategies vary
- GraSM and AIC methods average across all disjunctive common ancestors to avoid overestimating similarity
03
Corpus-Dependency of Information Content
Information content values are not intrinsic to the ontology—they depend on the reference corpus used for annotation frequency calculation. A term's IC is typically computed as the negative log of its annotation probability: IC(t) = -log(p(t)).
- Corpus choice matters: IC from UniProt differs from IC from a species-specific annotation set
- Intrinsic IC methods (e.g., topology-based IC) avoid corpus bias by deriving specificity from the ontology structure alone
- Annotation propagation rules (transitive closure) must be applied before frequency counting to avoid underestimating term occurrence
04
Term Pair to Gene Product Aggregation
Semantic similarity operates on individual GO terms, but biological queries typically involve gene products annotated with multiple terms. Aggregation strategies convert term-pair similarities into gene-level scores.
- Best-Match Average (BMA): Averages the maximum similarity for each term in set A against all terms in set B, and vice versa
- Maximum strategy: Takes the single highest term-pair similarity—sensitive but noisy
- Average strategy: Averages all pairwise similarities—dilutes signal from multi-domain proteins
- SimGIC: A Jaccard-like set overlap measure weighted by term IC, avoiding pairwise decomposition entirely
05
Partial Semantic Overlap and the Shallow Annotation Problem
Many gene products are incompletely annotated, with known functions missing from the GO database. This creates systematic underestimation of true functional similarity. Additionally, two proteins may share a deep functional similarity that is not captured by their explicit annotations because the relevant GO term has not yet been created.
- Annotation depth bias: Well-studied genes appear artificially more similar to each other
- Propagation strategies: Evidence code filtering (excluding IEA) can reduce but not eliminate bias
- Semantic drift: As the ontology evolves, similarity scores computed on older ontology versions may diverge from current biological understanding
06
Cross-Ontology Similarity Constraints
The GO comprises three disjoint sub-ontologies: Biological Process (BP), Molecular Function (MF), and Cellular Component (CC). Standard semantic similarity measures should not be applied across sub-ontology boundaries because the root nodes are distinct and the semantic spaces are incommensurable.
- Comparing a BP term to an MF term via a shared ancestor requires traversing to the root, yielding near-zero similarity
- Cross-ontology normalization is an active research problem for integrative analyses
- Practical pipelines compute separate similarity matrices per sub-ontology and aggregate results downstream
SEMANTIC SIMILARITY OF GO TERMS
Frequently Asked Questions
Explore the computational foundations of measuring functional relatedness between Gene Ontology terms using information-theoretic and graph-based approaches.
Semantic similarity of GO terms is a computational measure that quantifies the functional relatedness between two Gene Ontology terms based on the information content of their shared ancestors in the ontology graph. The calculation typically follows three paradigms: edge-based (structural) methods that count the number of edges between terms in the directed acyclic graph (DAG); node-based (information content) methods that weight terms by their specificity using negative log probability of occurrence in a reference corpus; and hybrid approaches that combine both strategies. The foundational algorithm computes the most informative common ancestor (MICA) —the shared parent term with the highest information content—and derives similarity as a function of the MICA's information content relative to the individual terms. Implementations like Wang's method aggregate the semantic contributions of all ancestor terms, while Resnik's measure uses only the MICA's information content. These scores range from 0 (no functional relationship) to values approaching the maximum information content of the ontology, enabling systematic comparison of gene products across biological process, molecular function, and cellular component sub-ontologies.
GO TERM FUNCTIONAL RELATEDNESS
Comparison of Semantic Similarity Measures
Quantitative comparison of computational approaches for measuring functional similarity between Gene Ontology terms based on information content and graph topology.
| Feature | Resnik (IC) | Lin (IC) | Wang (Topology) | Rel (Hybrid) |
|---|---|---|---|---|
Core Principle | Most informative common ancestor | Normalized shared information | Weighted edge distance in DAG | Information content + graph density |
Uses Information Content | ||||
Uses Graph Topology | ||||
Handles Multiple Inheritance | ||||
Normalized Score Range | ||||
Sensitive to Annotation Depth | ||||
Computational Complexity | O(n²) | O(n²) | O(n³) | O(n² log n) |
Typical Score Range | 0 to ~14 | 0 to 1 | 0 to 1 | 0 to 1 |
Enabling Efficiency, Speed & Accuracy
Intelligent Analysis, Decision & Execution
We build AI systems for teams that need search across company data, workflow automation across tools, or AI features inside products and internal software.
Talk to Us
Search across company data
Give teams answers from docs, tickets, runbooks, and product data with sources and permissions.
Useful when people spend too long searching or get different answers from different systems.
Enterprise searchRAGPermissions
Read more
Automate internal workflows
Use AI to route work, draft outputs, trigger actions, and keep approvals and logs in place.
Useful when repetitive work moves across multiple tools and teams.
AI agentsWorkflow automationGovernance
Read more
Add AI to products and internal tools
Build assistants, guided actions, or decision support into the software your team or customers already use.
Useful when AI needs to be part of the product, not a separate tool.
AI integrationDecision supportModel routing
Read more
About the author
Prasad Kumkar
CEO & MD, Inference Systems
Prasad Kumkar is the CEO & MD of Inference Systems and writes about AI systems architecture, LLM infrastructure, model serving, evaluation, and production deployment. Over 5+ years, he has worked across computer vision models, L5 autonomous vehicle systems, and LLM research, with a focus on taking complex AI ideas into real-world engineering systems.
His work and writing cover AI systems, large language models, AI agents, multimodal systems, autonomous systems, inference optimization, RAG, evaluation, and production AI engineering.
LinkedIn
Limited slotsGet a Free AI Consultation
Partnered with leading AI, data, and software stack.





How We Work
Custom AI workflows for your Business
One-fit-all AI don't work for modern businesses. At Inferensys, we aim to understand your business & custom requirements; which we use to define most efficient agentic workflows, the data, and the tools for your business.
01
Review the use case
We understand the task, the users, and where AI can actually help.
Read more02
Pick the right approach
We define what needs search, automation, or product integration.
Read more03
Build the first useful version
We implement the part that proves the value first.
Read more04
Improve from there
We add the checks and visibility needed to keep it useful.
Read moreThe first call is a practical review of your use case and the right next step.
Talk to Us