Dead stock is inventory that has remained completely inactive—with zero sales, transfers, or consumption—for an extended duration, typically 12 months or more, and for which the probability of future demand is statistically negligible. Unlike safety stock or cycle stock, which serve defined operational purposes, dead stock represents a complete failure of the demand forecasting and inventory planning process, tying up capital that could otherwise be deployed productively.

Glossary
Dead Stock
Inventory items that have experienced no sales or usage activity for a prolonged period and have no foreseeable demand, representing a total loss of working capital and incurring ongoing carrying costs.
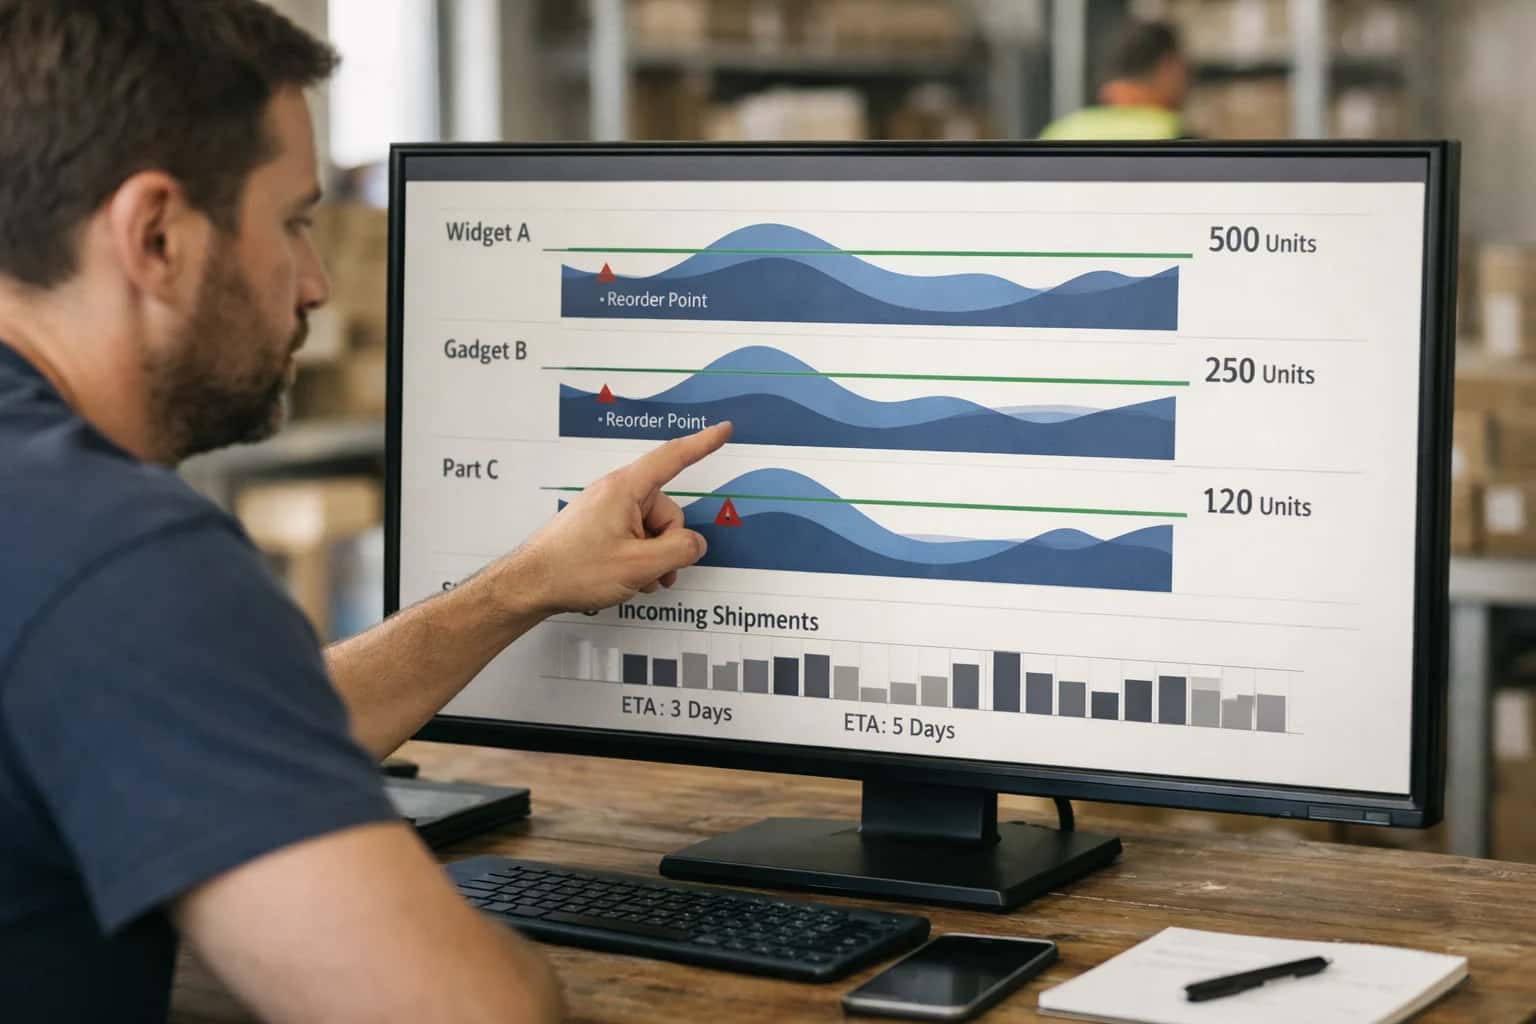
INVENTORY WASTE
What is Dead Stock?
Dead stock refers to inventory that has experienced no sales or usage for a prolonged period and has no foreseeable demand, representing a total loss of working capital.
The financial impact of dead stock extends beyond the sunk cost of the goods themselves. It incurs ongoing inventory carrying costs—including warehousing, insurance, and potential obsolescence write-downs—while occupying valuable storage capacity that could be allocated to active, revenue-generating SKUs. In multi-echelon inventory optimization frameworks, dead stock is treated as a constraint that distorts ABC-XYZ classification and inflates total system-wide holding costs, necessitating aggressive write-off or liquidation strategies to restore balance sheet accuracy.
IDENTIFYING NON-MOVING INVENTORY
Key Characteristics of Dead Stock
Dead stock is distinguished from slow-moving inventory by a complete cessation of demand and the absence of any realistic future consumption forecast. The following characteristics define this total loss of working capital.
01
Zero Demand Velocity
The defining characteristic is a prolonged period with absolutely no sales, usage, or consumption transactions. Unlike slow-moving or intermittent demand items, dead stock exhibits a flatline demand pattern. In enterprise resource planning systems, this is typically defined as no activity for 12 consecutive months, though the threshold varies by industry—fashion retail may use 6 months, while industrial spare parts may use 24 months. The critical distinction is that the item has transitioned from intermittent demand to zero velocity, indicating market obsolescence or complete loss of utility.
02
No Foreseeable Demand Signal
Advanced demand sensing algorithms and probabilistic forecasting models return a null or near-zero forecast with high confidence. Key indicators include:
- No open sales orders, backorders, or customer inquiries for the SKU
- The item has been discontinued by engineering or superseded by a new revision
- The associated finished good or parent assembly is end-of-life
- Market analysis confirms the product category has been rendered obsolete by technology shifts This characteristic separates dead stock from strategic safety stock, which is deliberately held against forecasted variability.
03
Negative Economic Contribution
Dead stock generates a persistent negative gross margin contribution through ongoing carrying costs without any offsetting revenue. The total cost of ownership includes:
- Capital cost: the frozen working capital that cannot be redeployed
- Storage cost: warehouse space, utilities, and material handling equipment
- Insurance and tax: recurring charges based on declared inventory value
- Obsolescence risk: the probability of further value deterioration or mandated disposal costs
- Opportunity cost: the lost revenue from productive inventory that could occupy the same space A standard calculation shows dead stock carrying costs eroding 20-35% of the item's book value annually.
04
Physical Degradation Indicators
In warehouse management systems, dead stock is frequently associated with quality hold codes and physical deterioration markers:
- Expired shelf-life dates for perishable goods or time-sensitive materials
- Revision obsolescence where the stocked revision is no longer compatible with current assemblies
- Physical damage from prolonged storage, including corrosion, dust contamination, or packaging degradation
- Non-conformance reports indicating the material fails current quality specifications These physical characteristics often trigger a write-down or write-off under accounting standards such as GAAP lower-of-cost-or-market rules.
05
Disproportionate Inventory Turnover Ratio
Dead stock catastrophically degrades aggregate inventory turnover metrics. While healthy supply chains target 6-12 turns annually, dead stock SKUs exhibit a turnover ratio approaching zero. This creates a dangerous distortion where a portfolio of mostly healthy inventory is masked by a few high-value dead items. Advanced ABC-XYZ classification isolates these items in the AZ or CZ quadrant—high value with zero predictability—flagging them for immediate financial review and potential disposal action.
06
Write-Down Accounting Treatment
Under IFRS and GAAP accounting standards, dead stock must be recognized through an inventory reserve or direct write-down when its net realizable value falls below cost. The accounting triggers include:
- IAS 2: inventories shall be measured at the lower of cost and net realizable value
- No movement for a defined aging bucket (commonly 365+ days) triggers an automatic reserve calculation
- The reserve percentage escalates with aging—50% at 12 months, 100% at 24 months in many policies
- The write-down is recognized as a charge to cost of goods sold, directly reducing EBITDA This characteristic transforms dead stock from an operational problem into a financial reporting liability.
DEAD STOCK CLARIFIED
Frequently Asked Questions
Clear, technical answers to the most common questions about identifying, quantifying, and preventing dead stock in multi-echelon inventory networks.
Dead stock is inventory that has experienced zero sales or usage activity over a prolonged period and has no foreseeable demand, representing a total loss of working capital. It differs fundamentally from slow-moving inventory, which still exhibits intermittent demand and retains a positive, albeit low, inventory turnover ratio. While slow-moving items can be managed through ABC-XYZ Classification strategies and demand shaping, dead stock is a sunk cost. The distinction is critical for financial reporting: slow-moving inventory is a current asset with a reduced net realizable value, whereas dead stock typically requires a full write-down or write-off, directly impacting the profit and loss statement. In a Multi-Echelon Inventory Optimization (MEIO) context, dead stock at any node distorts the system's view of true available inventory, leading to suboptimal replenishment decisions upstream.
Enabling Efficiency, Speed & Accuracy
Intelligent Analysis, Decision & Execution
We build AI systems for teams that need search across company data, workflow automation across tools, or AI features inside products and internal software.
Talk to Us
Search across company data
Give teams answers from docs, tickets, runbooks, and product data with sources and permissions.
Useful when people spend too long searching or get different answers from different systems.
Enterprise searchRAGPermissions
Read more
Automate internal workflows
Use AI to route work, draft outputs, trigger actions, and keep approvals and logs in place.
Useful when repetitive work moves across multiple tools and teams.
AI agentsWorkflow automationGovernance
Read more
Add AI to products and internal tools
Build assistants, guided actions, or decision support into the software your team or customers already use.
Useful when AI needs to be part of the product, not a separate tool.
AI integrationDecision supportModel routing
Read more
About the author
Prasad Kumkar
CEO & MD, Inference Systems
Prasad Kumkar is the CEO & MD of Inference Systems and writes about AI systems architecture, LLM infrastructure, model serving, evaluation, and production deployment. Over 5+ years, he has worked across computer vision models, L5 autonomous vehicle systems, and LLM research, with a focus on taking complex AI ideas into real-world engineering systems.
His work and writing cover AI systems, large language models, AI agents, multimodal systems, autonomous systems, inference optimization, RAG, evaluation, and production AI engineering.
LinkedIn
Limited slotsGet a Free AI Consultation
Partnered with leading AI, data, and software stack.





How We Work
Custom AI workflows for your Business
One-fit-all AI don't work for modern businesses. At Inferensys, we aim to understand your business & custom requirements; which we use to define most efficient agentic workflows, the data, and the tools for your business.
01
Review the use case
We understand the task, the users, and where AI can actually help.
Read more02
Pick the right approach
We define what needs search, automation, or product integration.
Read more03
Build the first useful version
We implement the part that proves the value first.
Read more04
Improve from there
We add the checks and visibility needed to keep it useful.
Read moreThe first call is a practical review of your use case and the right next step.
Talk to Us