A Profit-Optimized Buffer is a safety stock level calculated by balancing the marginal cost of holding additional inventory against the expected cost of stockouts to maximize overall profitability. Unlike traditional service-level-driven buffers that target a fixed probability of no stockout, this method explicitly models the economic trade-off between overstocking and understocking. It determines the precise inventory level where the incremental carrying cost of an additional unit equals the incremental profit loss avoided by preventing a stockout.

Glossary
Profit-Optimized Buffer
A safety stock level calculated by balancing the marginal cost of holding additional inventory against the expected cost of stockouts to maximize overall profitability.
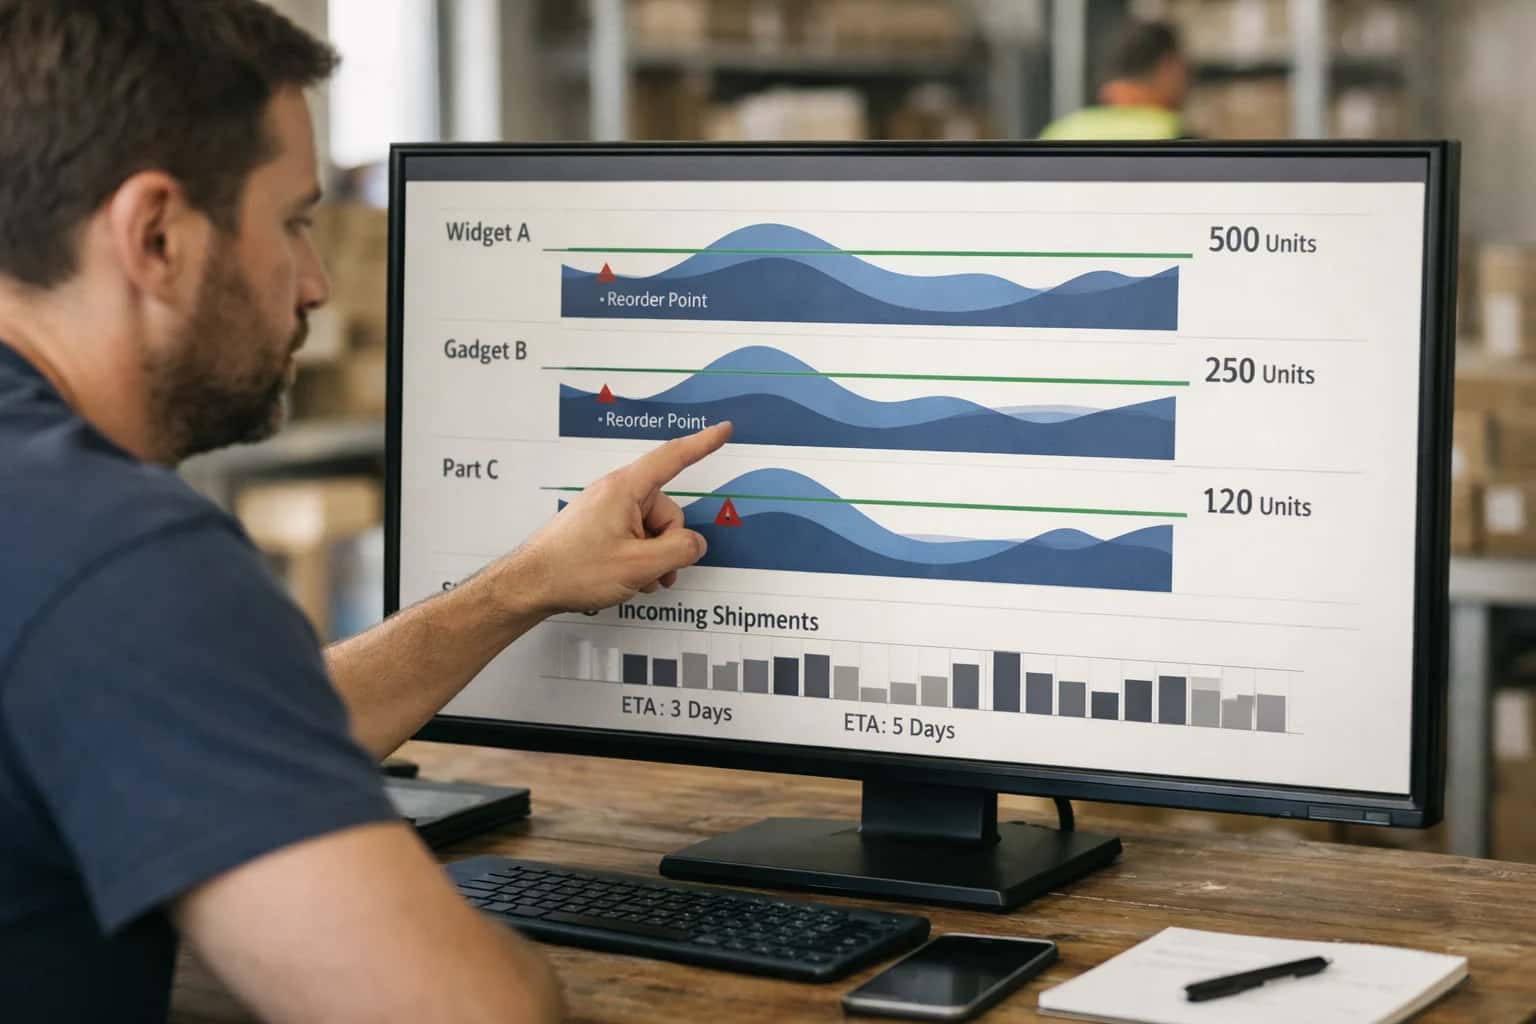
INVENTORY OPTIMIZATION
What is Profit-Optimized Buffer?
A safety stock level calculated by balancing the marginal cost of holding additional inventory against the expected cost of stockouts to maximize overall profitability.
This calculation requires accurate quantification of stockout cost, including lost sales, backorder processing, expediting fees, and long-term customer goodwill erosion. By integrating these financial inputs with probabilistic demand and lead time distributions, the profit-optimized buffer shifts inventory policy from a purely operational metric to a profit-maximizing decision variable. It is a core component of prescriptive analytics and dynamic safety stock calculation systems, enabling autonomous supply chains to continuously rebalance inventory investment against revenue protection.
ECONOMIC INVENTORY THEORY
Core Characteristics of Profit-Optimized Buffers
A profit-optimized buffer transcends traditional service-level targets by directly modeling the economic trade-off between holding costs and stockout penalties. The following characteristics define how these buffers maximize contribution margin rather than simply minimizing stockout frequency.
01
Marginal Cost Equilibrium
The buffer is sized at the precise point where the marginal cost of holding an additional unit equals the marginal expected cost of a stockout. This is the economic order quantity principle applied to safety stock. Holding one more unit incurs capital, storage, and obsolescence costs. Not holding it risks a lost sale, backorder processing, and customer goodwill erosion. The optimal buffer is the intersection of these two cost curves, not an arbitrary service level percentage.
Equilibrium Point
Optimization Target
02
Stockout Cost Quantification
Unlike traditional methods that use abstract service level targets, profit-optimized buffers require explicit stockout cost inputs. These include:
- Lost margin on the immediate sale
- Backorder processing costs (special handling, expedited shipping)
- Customer lifetime value erosion (probability of defection × future contribution margin)
- Contractual penalties for service-level agreement violations By monetizing failure, the model can rationally trade off inventory investment against real financial outcomes.
03
Holding Cost Granularity
The model incorporates a fully burdened carrying cost percentage that goes beyond simple cost of capital. Components include:
- Capital cost (weighted average cost of capital or hurdle rate)
- Storage and handling (warehouse space, labor, utilities)
- Obsolescence and shrinkage risk (perishability, theft, technological obsolescence)
- Insurance and taxes on held inventory This granularity ensures the buffer doesn't over-protect items where holding costs are disproportionately high relative to margin.
04
Profit-Maximizing Service Level
The output is not a buffer quantity alone but a derived optimal service level. The classic newsvendor critical ratio calculates this as: Cu / (Cu + Co), where Cu is the underage cost (stockout penalty) and Co is the overage cost (holding cost). This ratio directly yields the target cycle service level that maximizes expected profit. For high-margin items with low holding costs, the ratio approaches 99%+. For low-margin, expensive-to-hold items, it may drop to 80% or lower.
Cu / (Cu + Co)
Critical Ratio Formula
05
Dynamic Recalculation Triggers
Profit-optimized buffers are not static annual parameters. They are recalculated when underlying economics shift:
- Margin changes due to promotions, price adjustments, or cost inflation
- Holding cost fluctuations driven by interest rate changes or warehouse rate renegotiations
- Stockout cost revisions from updated customer churn models or new SLA agreements
- Demand distribution shifts detected by concept drift monitoring This ensures the buffer continuously tracks the true profit-maximizing point rather than drifting into suboptimality.
06
Segmentation by Profit Density
Items are classified not just by demand variability but by profit contribution per unit of inventory investment. This GMROII (Gross Margin Return on Inventory Investment) lens ensures that capital is allocated to buffers where it generates the highest marginal return. High profit-density items receive proportionally more protection, while low-density items are buffered conservatively. This portfolio approach maximizes aggregate profitability across the entire SKU assortment.
Enabling Efficiency, Speed & Accuracy
Intelligent Analysis, Decision & Execution
We build AI systems for teams that need search across company data, workflow automation across tools, or AI features inside products and internal software.
Talk to Us
Search across company data
Give teams answers from docs, tickets, runbooks, and product data with sources and permissions.
Useful when people spend too long searching or get different answers from different systems.
Enterprise searchRAGPermissions
Read more
Automate internal workflows
Use AI to route work, draft outputs, trigger actions, and keep approvals and logs in place.
Useful when repetitive work moves across multiple tools and teams.
AI agentsWorkflow automationGovernance
Read more
Add AI to products and internal tools
Build assistants, guided actions, or decision support into the software your team or customers already use.
Useful when AI needs to be part of the product, not a separate tool.
AI integrationDecision supportModel routing
Read morePROFIT-OPTIMIZED BUFFER
Frequently Asked Questions
Explore the core concepts behind profit-optimized buffers, a safety stock methodology that balances holding costs against stockout penalties to maximize overall profitability rather than simply hitting a service level target.
A profit-optimized buffer is a safety stock level calculated by balancing the marginal cost of holding additional inventory against the expected cost of stockouts to maximize overall profitability. Unlike traditional service-level-driven buffers that aim for a fixed probability of not stocking out, this method explicitly models the economic trade-off. The algorithm calculates the point where the cost of adding one more unit of inventory (capital, storage, obsolescence) exactly equals the expected benefit of avoiding a lost sale or backorder. This requires accurate inputs for stockout cost—including lost margin, customer goodwill erosion, and expediting fees—and holding cost as a percentage of unit value. The result is a buffer that may be lower or higher than a service-level target would dictate, depending on the product's margin profile and demand volatility.

About the author
Prasad Kumkar
CEO & MD, Inference Systems
Prasad Kumkar is the CEO & MD of Inference Systems and writes about AI systems architecture, LLM infrastructure, model serving, evaluation, and production deployment. Over 5+ years, he has worked across computer vision models, L5 autonomous vehicle systems, and LLM research, with a focus on taking complex AI ideas into real-world engineering systems.
His work and writing cover AI systems, large language models, AI agents, multimodal systems, autonomous systems, inference optimization, RAG, evaluation, and production AI engineering.
LinkedIn
Limited slotsGet a Free AI Consultation
Partnered with leading AI, data, and software stack.





How We Work
Custom AI workflows for your Business
One-fit-all AI don't work for modern businesses. At Inferensys, we aim to understand your business & custom requirements; which we use to define most efficient agentic workflows, the data, and the tools for your business.
01
Review the use case
We understand the task, the users, and where AI can actually help.
Read more02
Pick the right approach
We define what needs search, automation, or product integration.
Read more03
Build the first useful version
We implement the part that proves the value first.
Read more04
Improve from there
We add the checks and visibility needed to keep it useful.
Read moreThe first call is a practical review of your use case and the right next step.
Talk to Us