Data observability is the end-to-end capability to infer the internal state of a data system from its external outputs, specifically by monitoring the five pillars of freshness, quality, volume, schema, and lineage. It extends beyond traditional monitoring by providing rich context for debugging, enabling teams to answer not just when a pipeline broke, but why, and to assess the blast radius of downstream dependencies.

Glossary
Data Observability
Data observability is an organization's ability to fully understand the health and state of its data systems by monitoring metrics like freshness, quality, volume, schema, and lineage to detect anomalies.
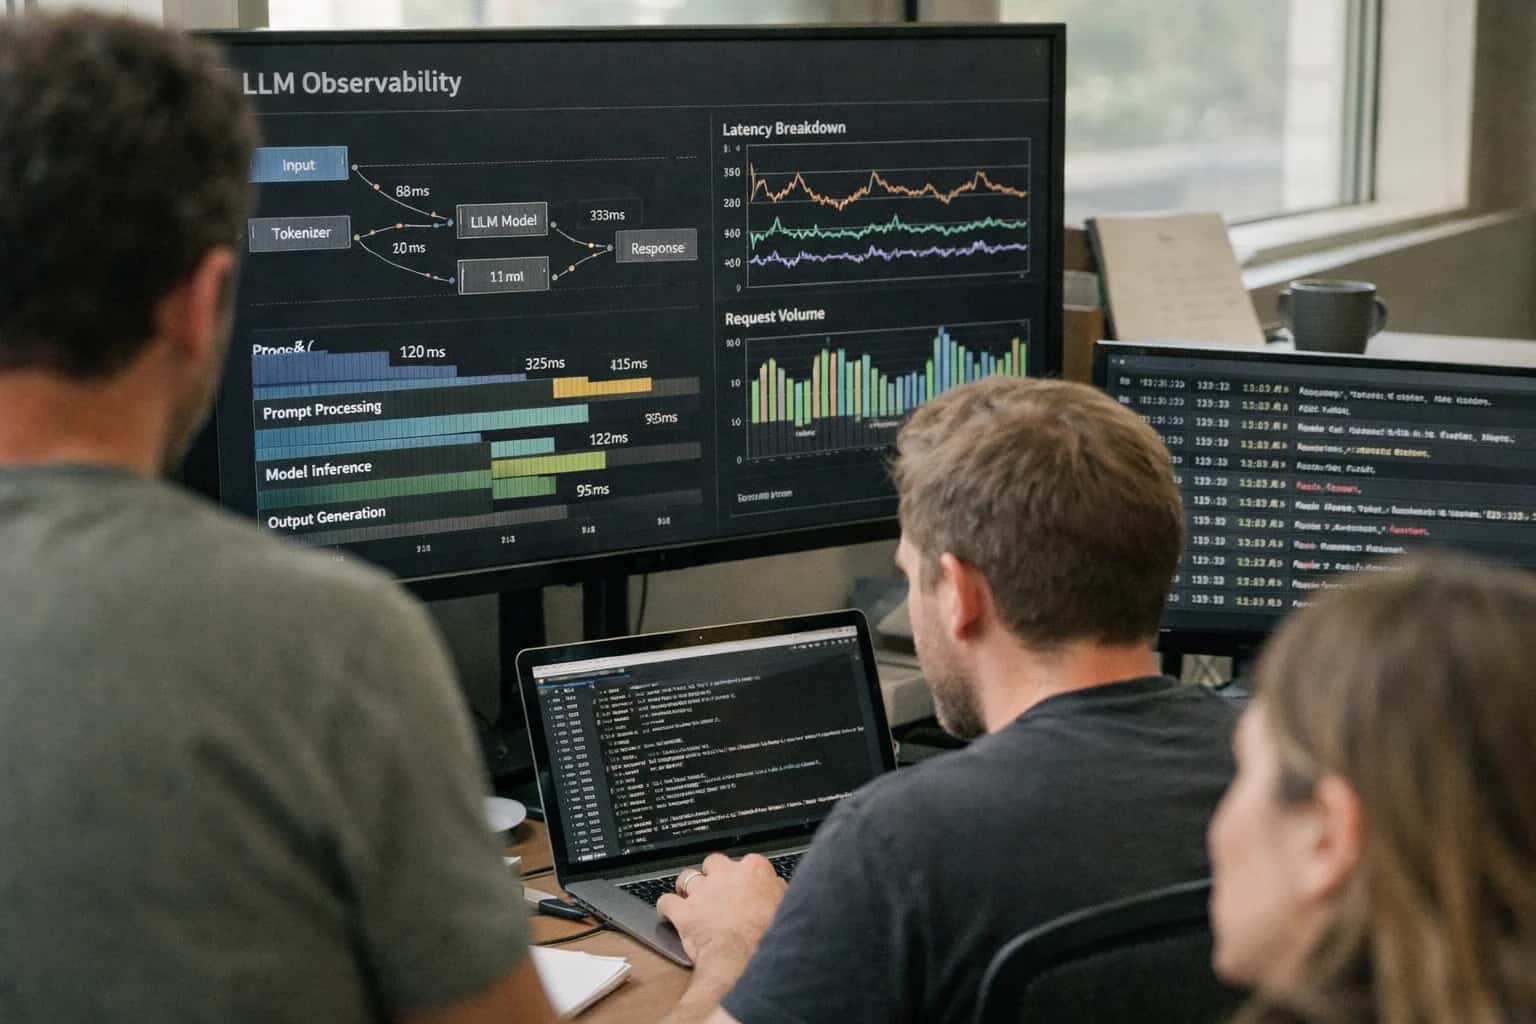
DATA PIPELINE HEALTH
What is Data Observability?
Data observability is an organization's ability to fully understand the health and state of its data systems by continuously monitoring key pillars to detect, resolve, and prevent data quality issues.
This discipline applies DevOps-style observability principles to the data engineering lifecycle, using automated monitoring, alerting, and triage to detect anomalies like unexpected schema changes or stale tables before they corrupt machine learning models or executive dashboards. By unifying metadata across the entire stack, data observability platforms provide a real-time provenance graph of data health, ensuring data reliability at scale.
MONITORING DATA HEALTH
The Five Pillars of Data Observability
Data observability is an organization's ability to fully understand the health and state of its data systems. These five pillars provide a comprehensive framework for monitoring and diagnosing issues across modern data pipelines.
01
Freshness
Measures how up-to-date data tables are and whether they have been updated within expected time windows. Freshness monitoring tracks the lag between when data is generated and when it becomes available for consumption.
- Key metric: Time since last update
- Example: A financial dashboard expecting trade data every 15 minutes triggers an alert if the pipeline stalls for over 30 minutes
- Impact: Stale data in machine learning feature stores leads to degraded model predictions and incorrect business decisions
< 5 min
Typical SLA for critical pipelines
02
Distribution
Assesses the statistical properties of data at the field level to detect unexpected shifts that may indicate broken pipelines or systemic errors. This pillar answers the question: does the data fall within an expected range?
- Key metric: Divergence from historical baseline (KL divergence, KS test)
- Example: A null rate on a
customer_idcolumn suddenly jumping from 0.1% to 15% signals an upstream ingestion failure - Impact: Undetected distribution shifts are a primary cause of silent model failure in production
03
Volume
Monitors the completeness and quantity of data arriving in tables, ensuring that records are neither missing nor duplicated. Volume checks provide a coarse-grained signal of pipeline health.
- Key metric: Row count vs. historical average
- Example: A daily sales table that typically receives 2 million rows suddenly dropping to 200,000 indicates a failed extract-transform-load job
- Impact: Incomplete data volumes cause downstream reports and dashboards to present misleading business metrics
04
Schema
Tracks changes to the structure and organization of data, including added, removed, or type-changed columns. Schema observability is critical for preventing breaking changes in production pipelines.
- Key metric: Schema change events detected
- Example: A
pricecolumn changing fromDECIMAL(10,2)toVARCHARbreaks downstream aggregations and model inference - Impact: Unannounced schema changes are the most common cause of data pipeline outages in complex microservice architectures
DATA OBSERVABILITY FAQ
Frequently Asked Questions
Clear, technical answers to the most common questions about monitoring, understanding, and ensuring the health of your data systems.
Data observability is an organization's ability to fully understand the health and state of its data systems by monitoring metrics like freshness, quality, volume, schema, and lineage to detect anomalies. While traditional monitoring tells you when something is broken based on predefined thresholds, observability tells you why it's broken and where the issue originated. Monitoring alerts on a known failure mode, such as a table not updating. Observability, by contrast, allows you to explore the data's entire provenance graph to diagnose an unknown problem, like a subtle data drift in an upstream source that is silently degrading a downstream machine learning model. It's the difference between a check-engine light and a full diagnostic scan.
Enabling Efficiency, Speed & Accuracy
Intelligent Analysis, Decision & Execution
We build AI systems for teams that need search across company data, workflow automation across tools, or AI features inside products and internal software.
Talk to Us
Search across company data
Give teams answers from docs, tickets, runbooks, and product data with sources and permissions.
Useful when people spend too long searching or get different answers from different systems.
Enterprise searchRAGPermissions
Read more
Automate internal workflows
Use AI to route work, draft outputs, trigger actions, and keep approvals and logs in place.
Useful when repetitive work moves across multiple tools and teams.
AI agentsWorkflow automationGovernance
Read more
Add AI to products and internal tools
Build assistants, guided actions, or decision support into the software your team or customers already use.
Useful when AI needs to be part of the product, not a separate tool.
AI integrationDecision supportModel routing
Read more
About the author
Prasad Kumkar
CEO & MD, Inference Systems
Prasad Kumkar is the CEO & MD of Inference Systems and writes about AI systems architecture, LLM infrastructure, model serving, evaluation, and production deployment. Over 5+ years, he has worked across computer vision models, L5 autonomous vehicle systems, and LLM research, with a focus on taking complex AI ideas into real-world engineering systems.
His work and writing cover AI systems, large language models, AI agents, multimodal systems, autonomous systems, inference optimization, RAG, evaluation, and production AI engineering.
LinkedIn
Limited slotsGet a Free AI Consultation
Partnered with leading AI, data, and software stack.





How We Work
Custom AI workflows for your Business
One-fit-all AI don't work for modern businesses. At Inferensys, we aim to understand your business & custom requirements; which we use to define most efficient agentic workflows, the data, and the tools for your business.
01
Review the use case
We understand the task, the users, and where AI can actually help.
Read more02
Pick the right approach
We define what needs search, automation, or product integration.
Read more03
Build the first useful version
We implement the part that proves the value first.
Read more04
Improve from there
We add the checks and visibility needed to keep it useful.
Read moreThe first call is a practical review of your use case and the right next step.
Talk to Us