OpenTelemetry for LLMs excels at vendor-agnostic instrumentation and deep system integration because it is a CNCF standard with broad ecosystem support. For example, you can instrument a complex RAG pipeline using the opentelemetry-instrumentation-langchain SDK, exporting traces to any backend that supports OTLP, like Jaeger or Grafana, for a unified view of your entire application stack. This approach provides maximum control and avoids lock-in, but requires significant engineering effort to build dashboards, evaluations, and analytics on top of the raw telemetry data.

Comparison
OpenTelemetry for LLMs vs. Langfuse
A technical analysis comparing the standard telemetry framework, OpenTelemetry, against the purpose-built LLM observability platform, Langfuse. This guide evaluates the core trade-offs between vendor-agnostic instrumentation and pre-built LLM traces, evaluations, and analytics for engineering leaders.
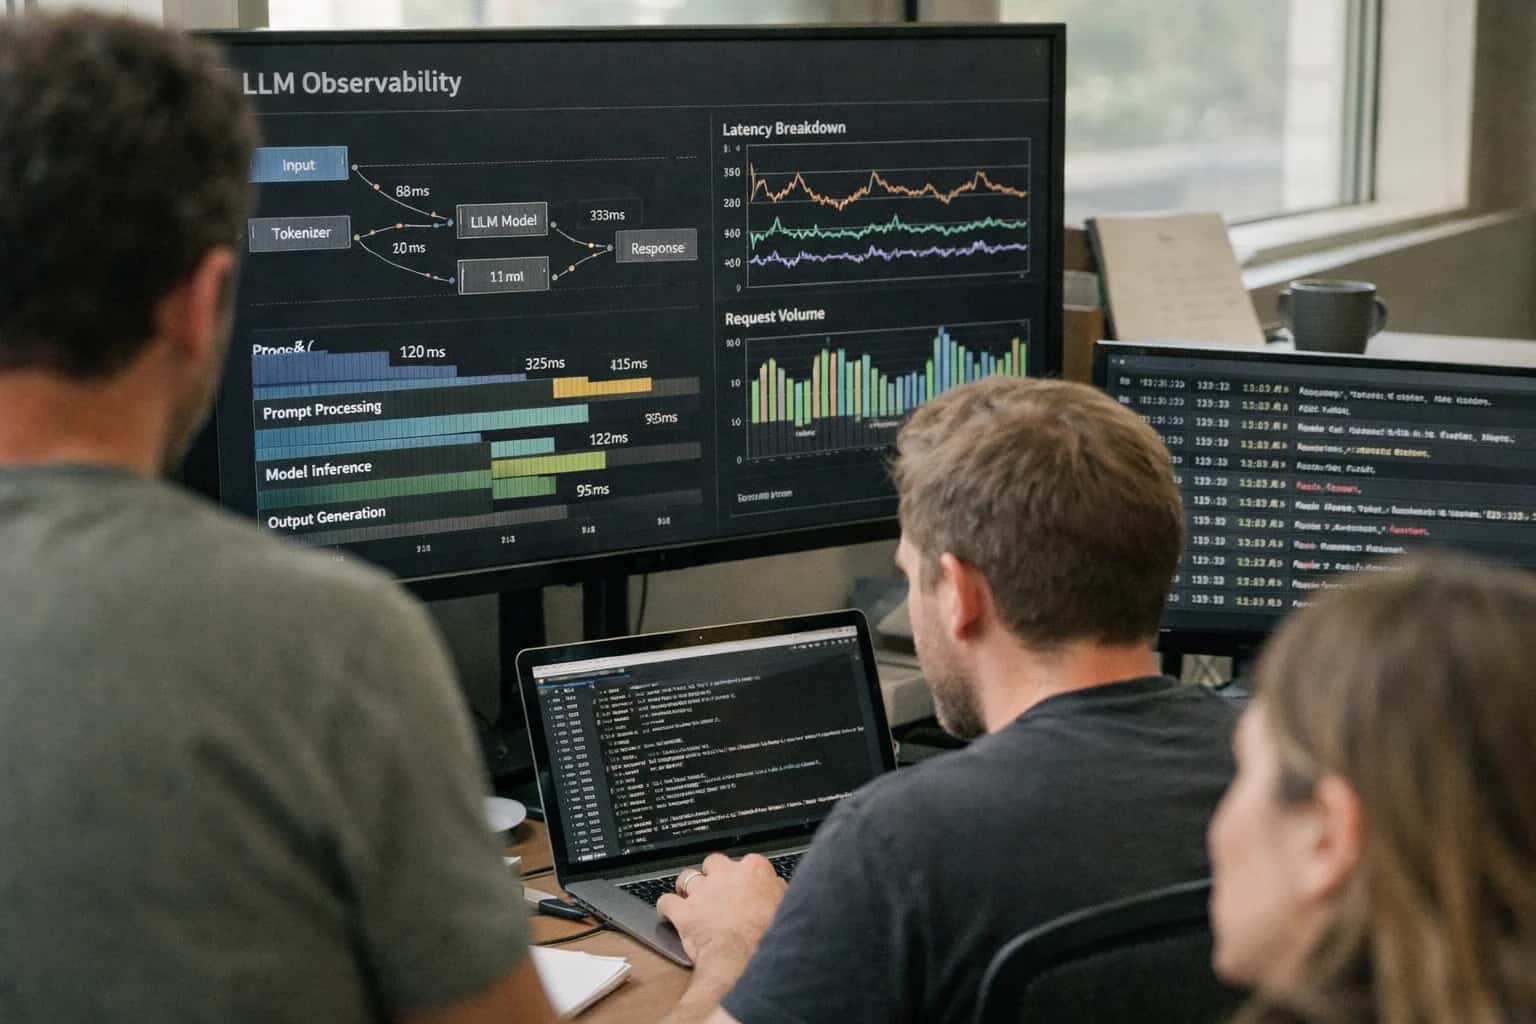
THE ANALYSIS
Introduction
A foundational comparison between the open-standard telemetry framework and a purpose-built platform for LLM observability.
Langfuse takes a different approach by providing a pre-integrated, LLM-native observability platform. This strategy results in immediate, out-of-the-box value with features like granular trace visualization for agentic workflows, built-in prompt management, and human feedback collection. For instance, Langfuse can automatically score a trace for hallucinations or cost without requiring you to write custom evaluators, drastically reducing the time to actionable insights. The trade-off is a degree of platform dependency and less flexibility for deeply custom telemetry pipelines compared to the raw power of OpenTelemetry.
The key trade-off: If your priority is long-term flexibility, avoiding vendor lock-in, and integrating LLM traces into a broader enterprise observability strategy, choose OpenTelemetry. You'll build exactly what you need, as seen in our guide on implementing custom LLM evaluations. If you prioritize rapid time-to-value, pre-built LLM analytics, and minimizing the operational overhead of building an observability layer from scratch, choose Langfuse. For a deeper look at production deployment, see our analysis of Langfuse vs. Arize Phoenix.
HEAD-TO-HEAD COMPARISON
OpenTelemetry for LLMs vs. Langfuse
Direct comparison of a vendor-agnostic telemetry standard versus a purpose-built LLM observability platform.
| Metric / Feature | OpenTelemetry for LLMs | Langfuse |
|---|---|---|
Primary Architecture | Instrumentation SDKs & Collector | Integrated SaaS/OSS Platform |
Out-of-the-Box LLM Traces | ||
Pre-built LLM Evaluations (e.g., Hallucination) | ||
Vendor Lock-in Risk | Low | Medium (SaaS) / Low (OSS) |
Integration Effort (LLM App) | High (Manual instrumentation) | Low (SDK auto-instrumentation) |
Native Cost & Token Analytics | ||
Trace Visualization & Debugging | Requires 3rd-party backend (e.g., Jaeger) | Built-in UI |
Supported Standards | OTLP, W3C TraceContext | OpenTelemetry, Custom APIs |
OpenTelemetry vs. Langfuse
TL;DR Summary
A quick scan of the core trade-offs between the universal telemetry standard and the purpose-built LLM observability platform.
01
OpenTelemetry: Ultimate Flexibility
Vendor-agnostic instrumentation: Export traces to any backend (Datadog, New Relic, custom). This matters for teams with existing APM investments or strict multi-cloud requirements.
02
OpenTelemetry: Standardized Foundation
Widely adopted ecosystem: Part of the CNCF, with SDKs for 10+ languages. This matters for building a future-proof, portable observability stack that avoids proprietary lock-in.
03
Langfuse: LLM-Native Traces
Pre-built LLM semantics: Automatically captures spans for prompts, tool calls, and retrievals with rich metadata. This matters for developers who want deep, out-of-the-box visibility into LangChain or LlamaIndex workflows without manual instrumentation.
04
Langfuse: Integrated Analytics & Eval
Unified platform for traces and feedback: Combines detailed tracing with built-in evaluation (scores, human feedback) and analytics dashboards. This matters for teams needing to rapidly iterate on prompts and monitor quality without stitching multiple tools together.
05
Choose OpenTelemetry for...
Enterprise-scale, polyglot systems where LLMs are one component among many. Ideal if you need to correlate LLM latency with database queries and microservice calls in a single pane of glass using tools like Datadog LLM Observability.
06
Choose Langfuse for...
Fast-moving LLM application teams prioritizing developer velocity. Best for projects where the primary focus is debugging complex agentic chains, running A/B tests on prompts, and managing human-in-the-loop evaluations, similar to use cases for Arize Phoenix vs. Langfuse.
CHOOSE YOUR PRIORITY
When to Choose: User Scenarios
OpenTelemetry for RAG
Verdict: Best for teams needing deep, custom instrumentation across a heterogeneous tech stack. Strengths: Vendor-agnostic standard allows you to instrument every component—your vector database (Pinecone, Qdrant), embedding models, and retrieval logic—with consistent traces. You can export to any backend (Jaeger, Grafana) and correlate LLM latency with database p99 performance. Ideal for complex, multi-stage pipelines where you need to trace a query from user input through chunk retrieval to final generation. Considerations: Requires significant engineering effort to instrument LLM-specific spans (e.g., token usage, model vendor) and build custom dashboards for LLM metrics.
Langfuse for RAG
Verdict: The faster path to actionable insights for RAG-specific performance and quality. Strengths: Pre-built LLM tracing automatically captures prompts, completions, token counts, costs, and latency out-of-the-box. Its built-in evaluations are crucial for RAG, allowing you to score answer relevance and faithfulness to retrieved context without writing custom code. The analytics UI instantly shows retrieval hit rates and cost per query. Integrates seamlessly with LangChain and LlamaIndex. Considerations: Less flexible for instrumenting non-LLM infrastructure components compared to OpenTelemetry's universal standard.
Enabling Efficiency, Speed & Accuracy
Intelligent Analysis, Decision & Execution
We build AI systems for teams that need search across company data, workflow automation across tools, or AI features inside products and internal software.
Talk to Us
Search across company data
Give teams answers from docs, tickets, runbooks, and product data with sources and permissions.
Useful when people spend too long searching or get different answers from different systems.
Enterprise searchRAGPermissions
Read more
Automate internal workflows
Use AI to route work, draft outputs, trigger actions, and keep approvals and logs in place.
Useful when repetitive work moves across multiple tools and teams.
AI agentsWorkflow automationGovernance
Read more
Add AI to products and internal tools
Build assistants, guided actions, or decision support into the software your team or customers already use.
Useful when AI needs to be part of the product, not a separate tool.
AI integrationDecision supportModel routing
Read moreTHE ANALYSIS
Verdict and Final Recommendation
Choosing between a universal standard and a specialized platform depends on your team's core priorities and existing infrastructure.
OpenTelemetry for LLMs excels at vendor-agnostic instrumentation and future-proofing because it leverages a widely adopted CNCF standard with a rich ecosystem of backends (e.g., Jaeger, Prometheus, Datadog, New Relic). For example, instrumenting a complex RAG pipeline with the OpenTelemetry Python SDK allows you to export traces to any OTLP-compatible backend, avoiding lock-in and enabling correlation with non-AI application metrics. This approach is ideal for enterprises with mature observability stacks who need to integrate LLM traces into a unified system of record.
Langfuse takes a different approach by providing a pre-integrated, LLM-native observability platform with batteries-included features like trace visualization, prompt management, and human feedback collection. This results in a trade-off between out-of-the-box functionality and architectural flexibility. Langfuse's dedicated UI and SDKs for frameworks like LangChain and LlamaIndex can reduce initial setup time from weeks to hours, offering immediate visibility into token usage, latency, and chain-of-thought reasoning without configuring multiple collectors and exporters.
The key trade-off: If your priority is long-term flexibility, avoiding vendor lock-in, and integrating LLM telemetry into a broader enterprise observability strategy, choose OpenTelemetry. You accept higher initial integration complexity for ultimate control. If you prioritize rapid time-to-value, dedicated LLM analytics, and minimizing DevOps overhead for a focused AI team, choose Langfuse. You gain a tailored experience but commit to its specific data model and hosted/self-hosted deployment options. For a deeper dive into the ecosystem, see our comparisons of Arize Phoenix vs. Langfuse and Datadog LLM Observability vs. New Relic AI Monitoring.

About the author
Prasad Kumkar
CEO & MD, Inference Systems
Prasad Kumkar is the CEO & MD of Inference Systems and writes about AI systems architecture, LLM infrastructure, model serving, evaluation, and production deployment. Over 5+ years, he has worked across computer vision models, L5 autonomous vehicle systems, and LLM research, with a focus on taking complex AI ideas into real-world engineering systems.
His work and writing cover AI systems, large language models, AI agents, multimodal systems, autonomous systems, inference optimization, RAG, evaluation, and production AI engineering.
LinkedIn
Limited slotsGet a Free AI Consultation
Partnered with leading AI, data, and software stack.





How We Work
Custom AI workflows for your Business
One-fit-all AI don't work for modern businesses. At Inferensys, we aim to understand your business & custom requirements; which we use to define most efficient agentic workflows, the data, and the tools for your business.
01
Review the use case
We understand the task, the users, and where AI can actually help.
Read more02
Pick the right approach
We define what needs search, automation, or product integration.
Read more03
Build the first useful version
We implement the part that proves the value first.
Read more04
Improve from there
We add the checks and visibility needed to keep it useful.
Read moreThe first call is a practical review of your use case and the right next step.
Talk to Us